
Where Data Tells the Story
© Voronoi 2026. All rights reserved.

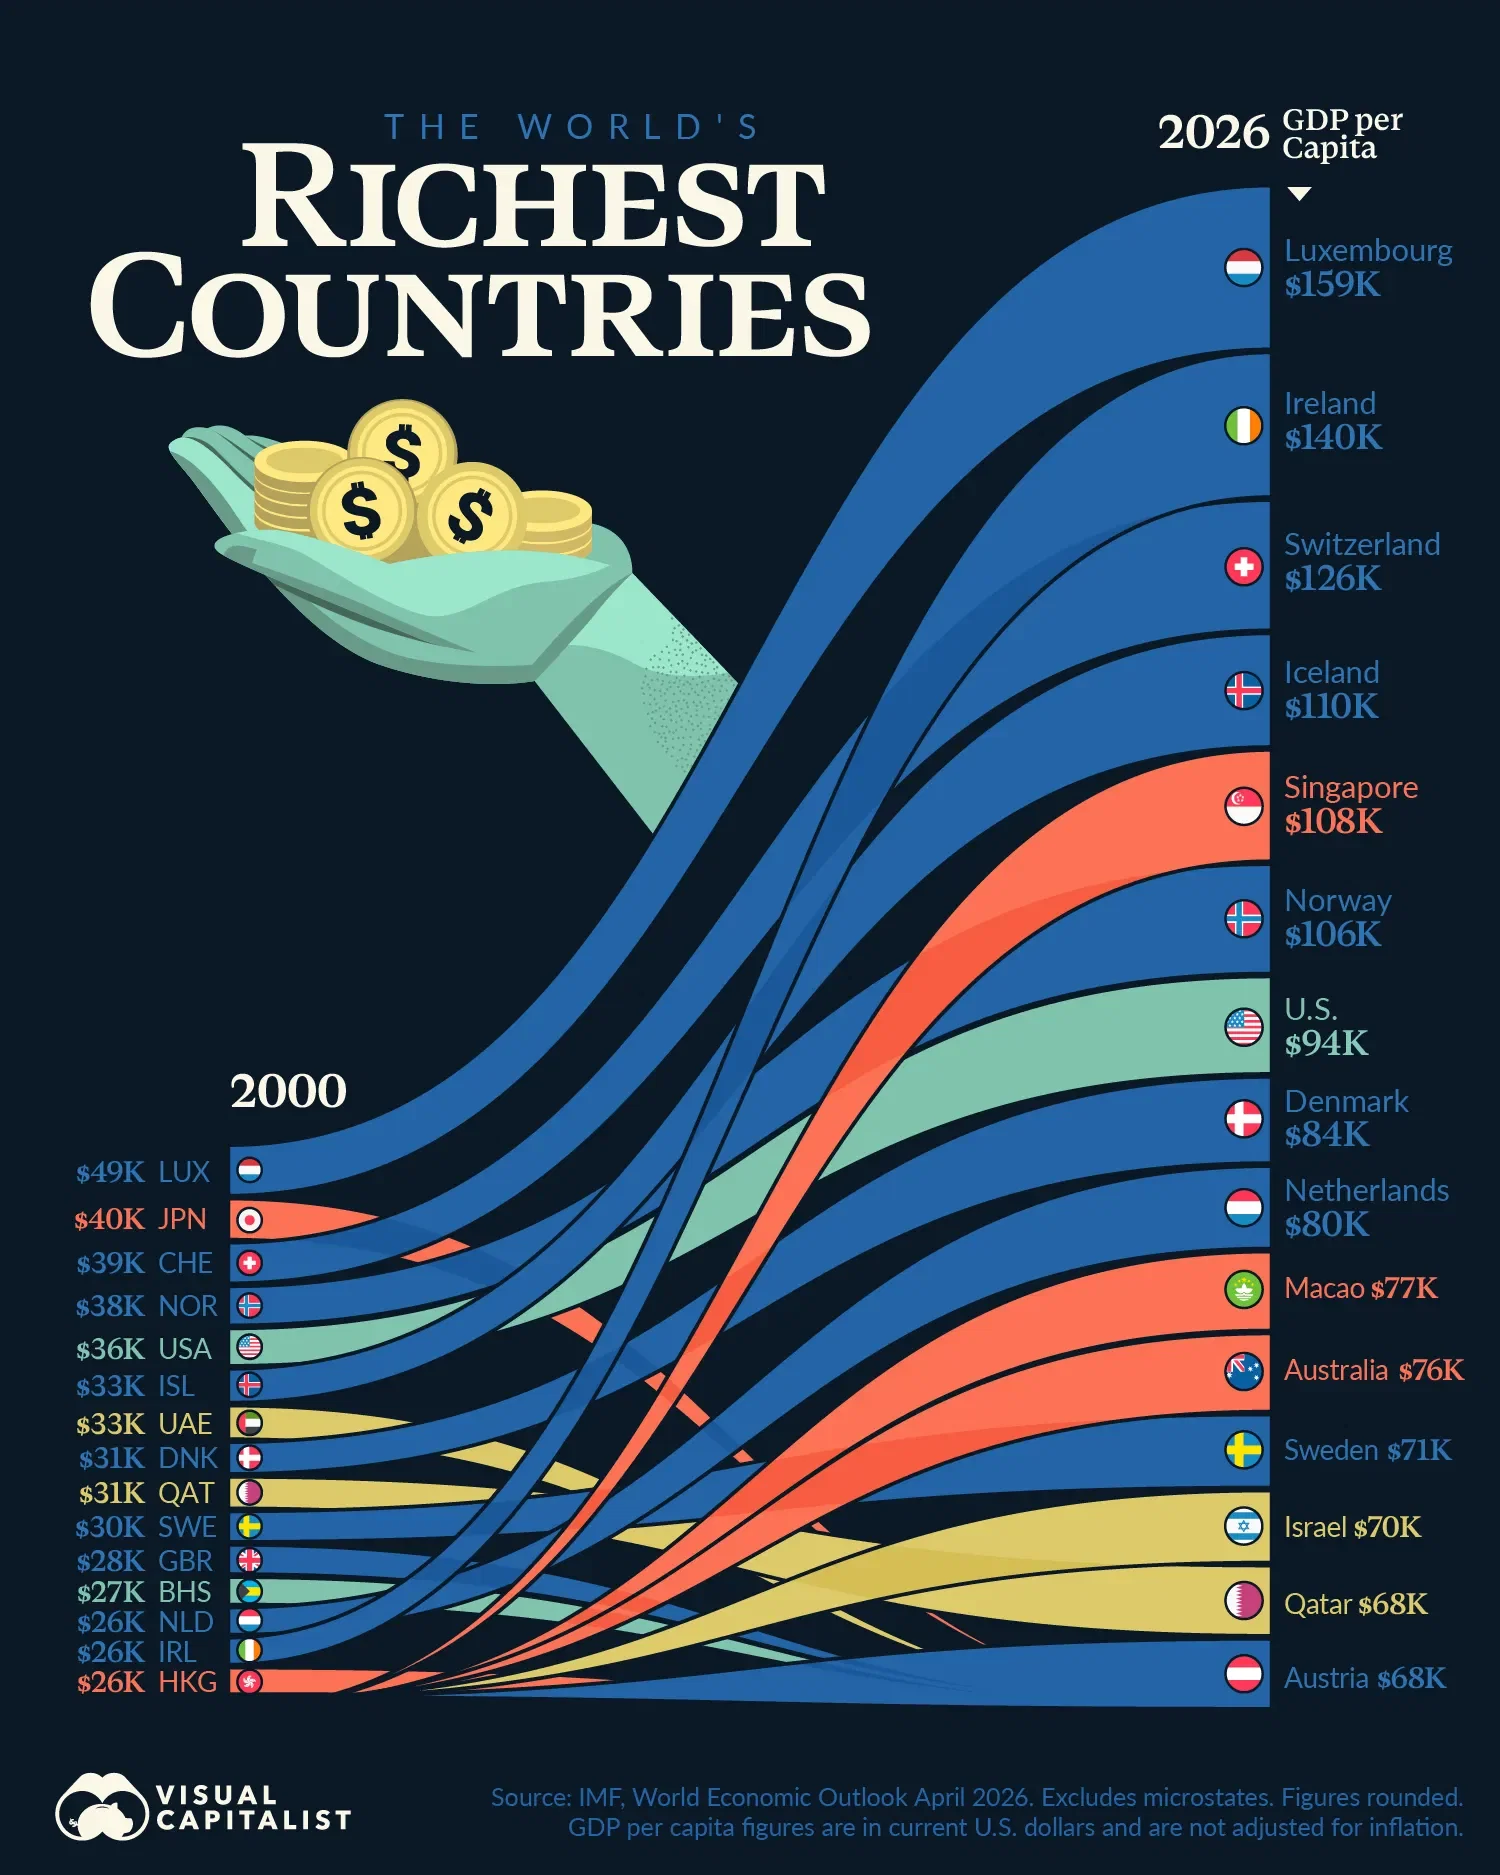
The world’s richest countries look very different than they did 25 years ago.
Ireland has climbed from 14th place to second, while Japan has fallen from #2 to #39 despite remaining the world’s fourth-largest economy. These shifts highlight how globalization, technology investment, demographics, and currency movements have reshaped economic prosperity over time.
Using data from the International Monetary Fund’s latest World Economic Outlook, this graphic compares GDP per capita across the world’s richest countries in 2000 and 2026. Figures are shown in current U.S. dollars and are not adjusted for inflation.
Read the full article here.