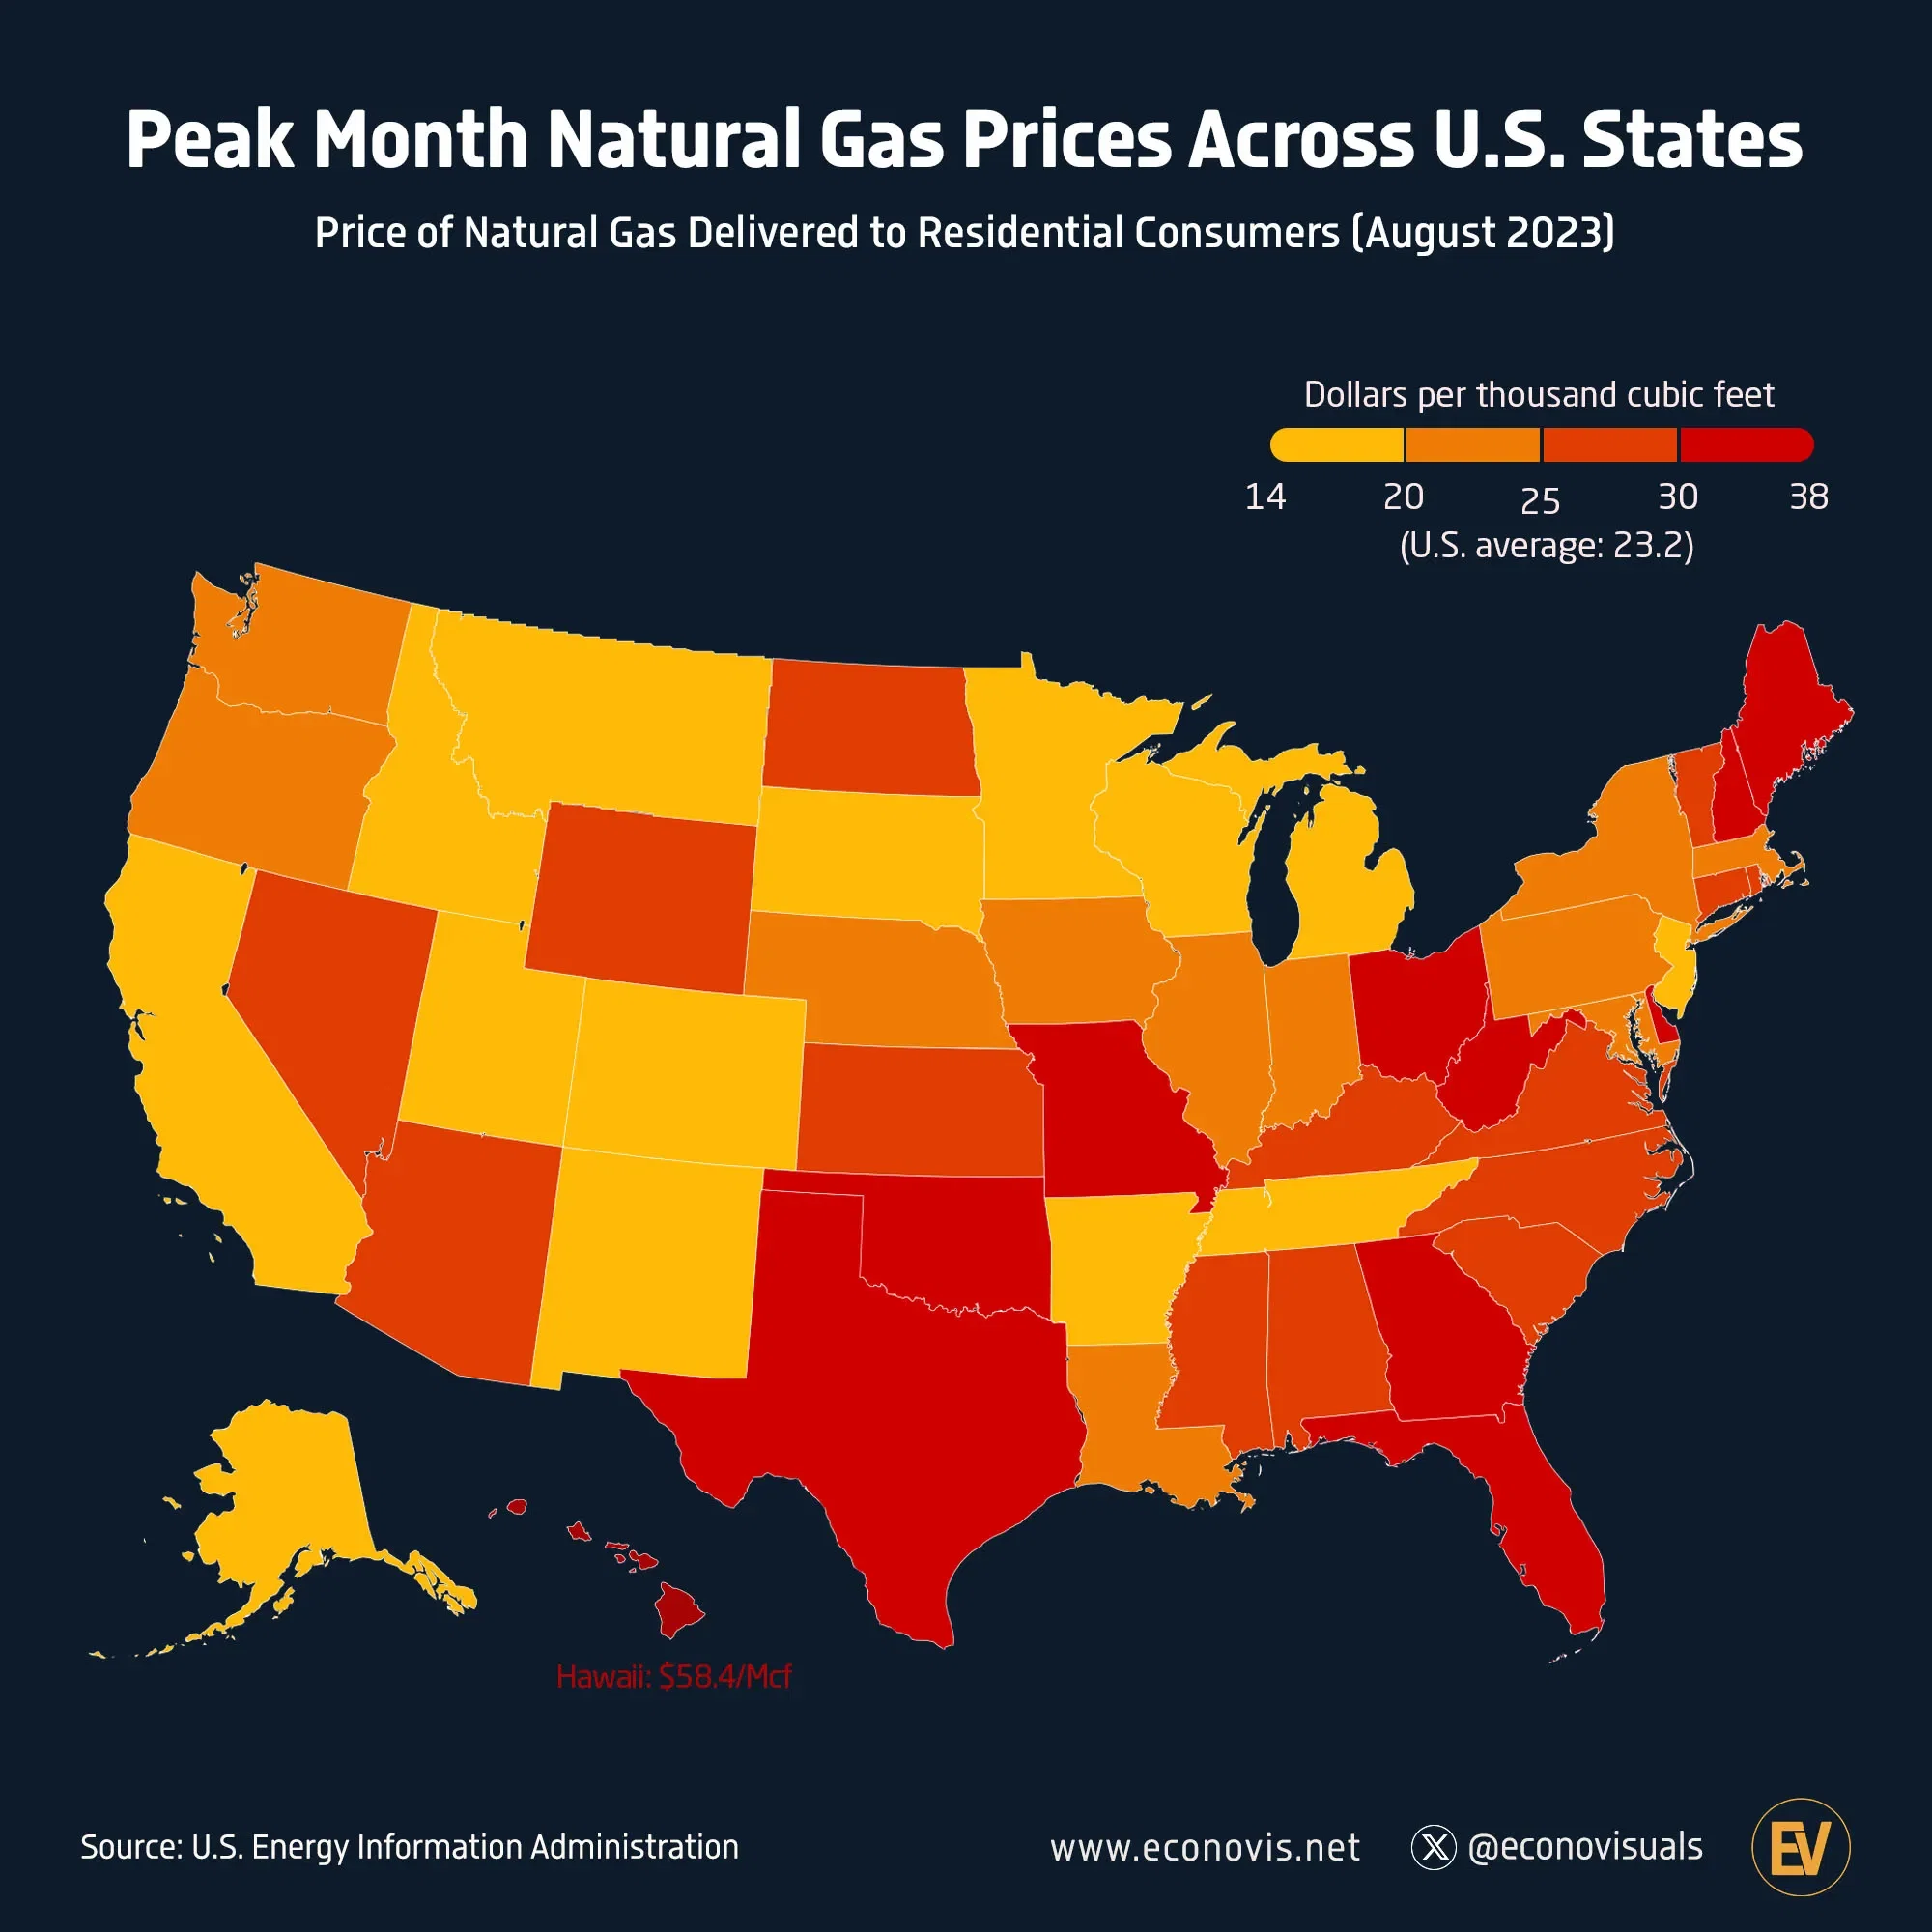
Peak Month Natural Gas Prices Across U.S. States
Price of Natural Gas Delivered to Residential Consumers (August 2023)
The average price of natural gas for U.S. residential consumers stood at $23.23 per thousand cubic feet (USD/Mcf) during the period from January to November 2023. Notably, the cost exhibited a fluctuation, reaching a minimum of $13.36 USD/Mcf in November and peaking at $23.23 USD/Mcf in August.
In August 2023, there was considerable disparity in natural gas prices across U.S. states. Montana recorded the lowest rate at $14.03 USD/Mcf, while Hawaii reported the highest at $58.43 USD/Mcf. States such as Montana, Alaska, and Idaho experienced the lowest prices, all below $15 USD/Mcf. Conversely, Missouri, Texas, Delaware, Florida, New Hampshire, Oklahoma, West Virginia, Georgia, Ohio, and Hawaii faced the highest prices, exceeding $30 USD/Mcf in August 2023.
Dataset
Price of Natural Gas Delivered to Residential Consumers (August 2023) | |
---|---|
U.S. | 23.23 |
Alabama | 27.87 |
Alaska | 14.26 |
Arizona | 29.64 |
Arkansas | 19.85 |
California | 18.17 |
Colorado | 15.48 |
Connecticut | 25.93 |
Delaware | 32.43 |
District of Columbia | 24.71 |
Florida | 32.57 |
Georgia | 36.63 |
Hawaii | 58.43 |
Idaho | 14.47 |
Illinois | 24.86 |
Indiana | 23.52 |
Iowa | 22.08 |
Kansas | 27.08 |
Kentucky | 28.96 |
Louisiana | 23.44 |
Maryland | 24.7 |
Massachusetts | 20.11 |
Michigan | 16.17 |
Minnesota | 15.39 |
Mississippi | 26.75 |
Missouri | 31.25 |
Montana | 14.03 |
Nebraska | 22.27 |
Nevada | 27.38 |
New Hampshire | 32.96 |
New Jersey | 17.22 |
New Mexico | 16.14 |
New York | 22.69 |
North Carolina | 25.88 |
North Dakota | 25.15 |
Ohio | 37.88 |
Oklahoma | 34.13 |
Oregon | 22.6 |
Pennsylvania | 24.21 |
Rhode Island | 27.18 |
South Carolina | 26.67 |
South Dakota | 17.86 |
Tennessee | 18.31 |
Texas | 31.68 |
Utah | 16.89 |
Vermont | 27.75 |
Virginia | 25.99 |
Washington | 22.25 |
West Virginia Price of Natural Gas Delivered to Residential Consumers (Dollars per Thousand Cubic Feet) | 36.6 |
Wisconsin | 16.72 |