Where Data Tells the Story
© Voronoi 2025. All rights reserved.

Panama Canal Traffic by Shipment Category and Tonnage
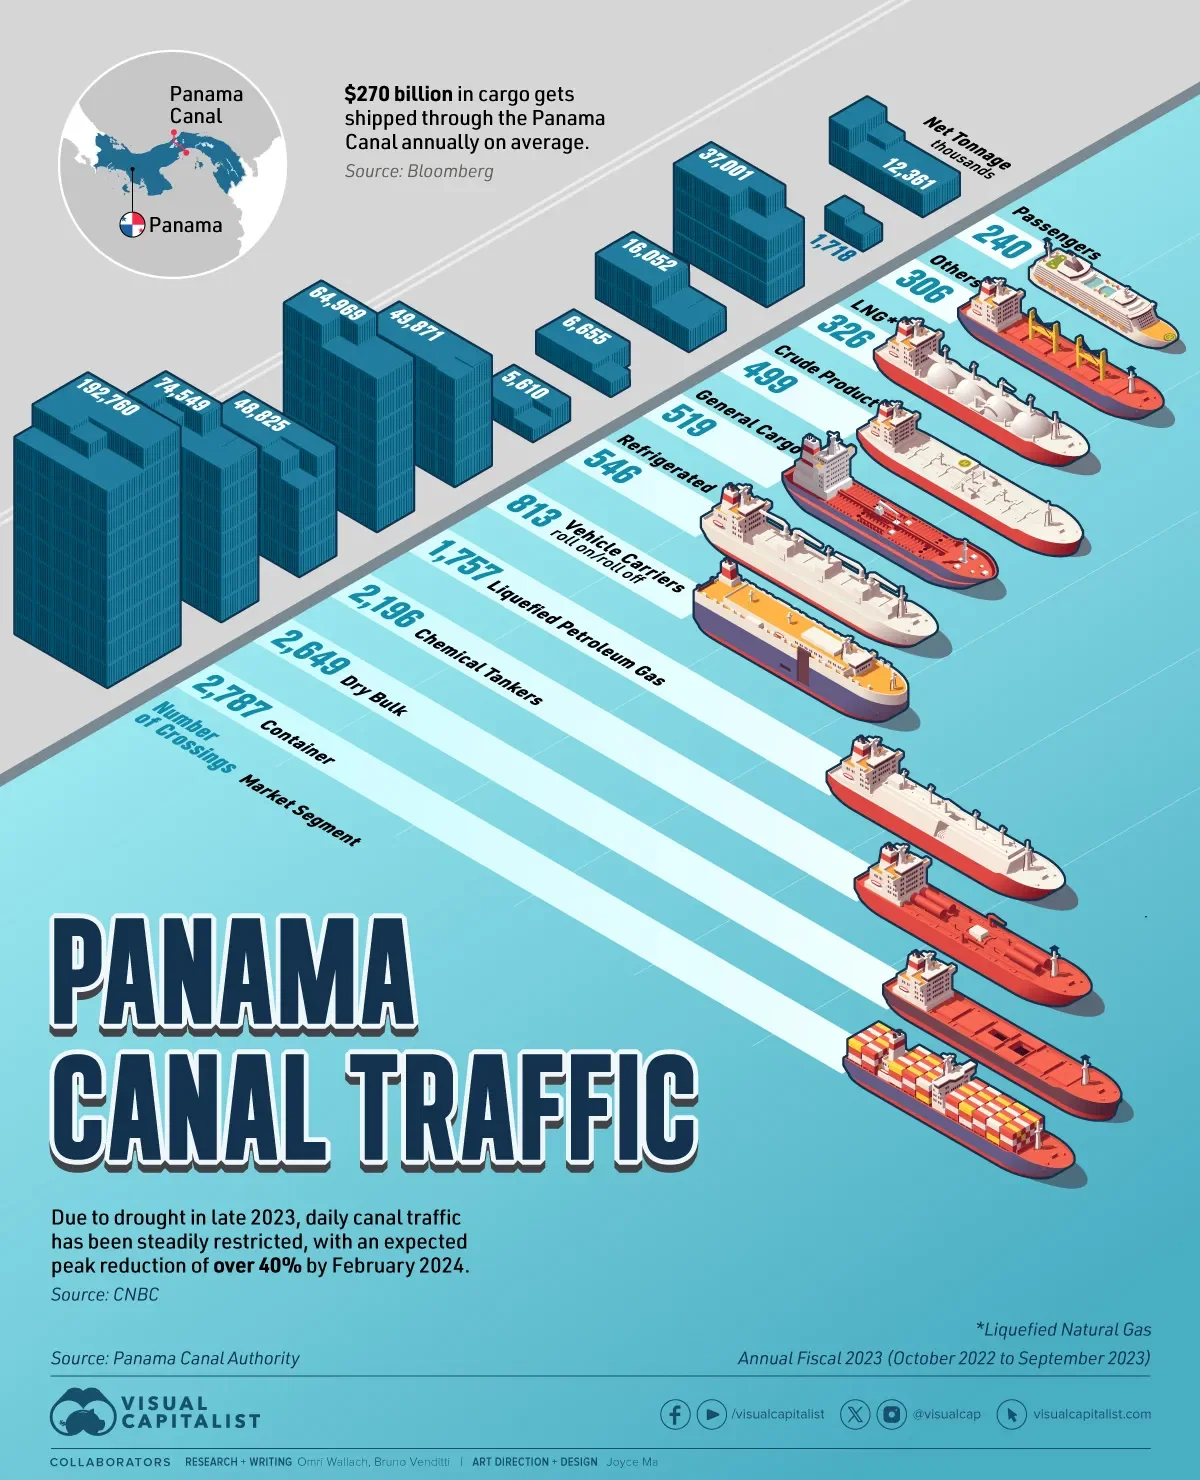
Daily Panama Canal traffic has been steadily restricted, with an expected peak reduction of over 40% by February 2024 due to severe drought. The problem is already affecting supply chains for U.S. and Asian importers.
This graphic illustrates the number of shipping crossings by market segment at the Canal and the net tonnage carried during the Annual Fiscal 2023 (October 2022 to September 2023). Data is from the Panama Canal Authority.
The Driest October in 70 Years
The Panama Canal is an artificial 82-kilometer (51-mile) waterway that connects the Pacific Ocean with the Atlantic Ocean, built between 1904 and 1914.
The Canal locks at each end lift ships to Gatun Lake, an artificial freshwater lake 26 meters (85 ft) above sea level. The shortcut dramatically reduces the time for ships to travel between the two oceans, enabling them to avoid the route around the southernmost tip of South America via the Drake Passage or Strait of Magellan.
The Panama Canal moves roughly $270 billion worth of cargo annually – it’s the trade route taken by 40% of all U.S. container traffic alone and handles about 5% of all global maritime trade.
Last October, however, Panama received 41% less rainfall than usual, leading to the driest October in 70 years in what was supposed to be Panama’s rainy season, bringing the level of the Gatun Lake almost 6 feet below where it was a year ago. Additionally, infrastructure constraints led the Panama Canal Authority to restrict the number of ships that could pass each day.
The principal commodity groups carried through the Canal are motor vehicles, petroleum products, grains, coal, and coke.
According to the Panama Canal Authority, most of its traffic came from containers and dry bulk like soybeans. The world’s largest operator of chemical tankers (Stolt-Nielsen) typically also uses the Canal. However, due to the drought and the backup at the crossing, the operator has decided to reroute its fleet to the Suez Canal.
Although representing the smaller number of crossings, the Canal is also an important route for passengers, with many ocean cruise lines offering popular Panama Canal itineraries that sail through the Canal in the approximately 8-hour passage to their next destination in the opposite ocean.