EconomyMar 21, 2024
Mapping Unemployment Claims per 100,000 Workers 🔎
What we’re showing
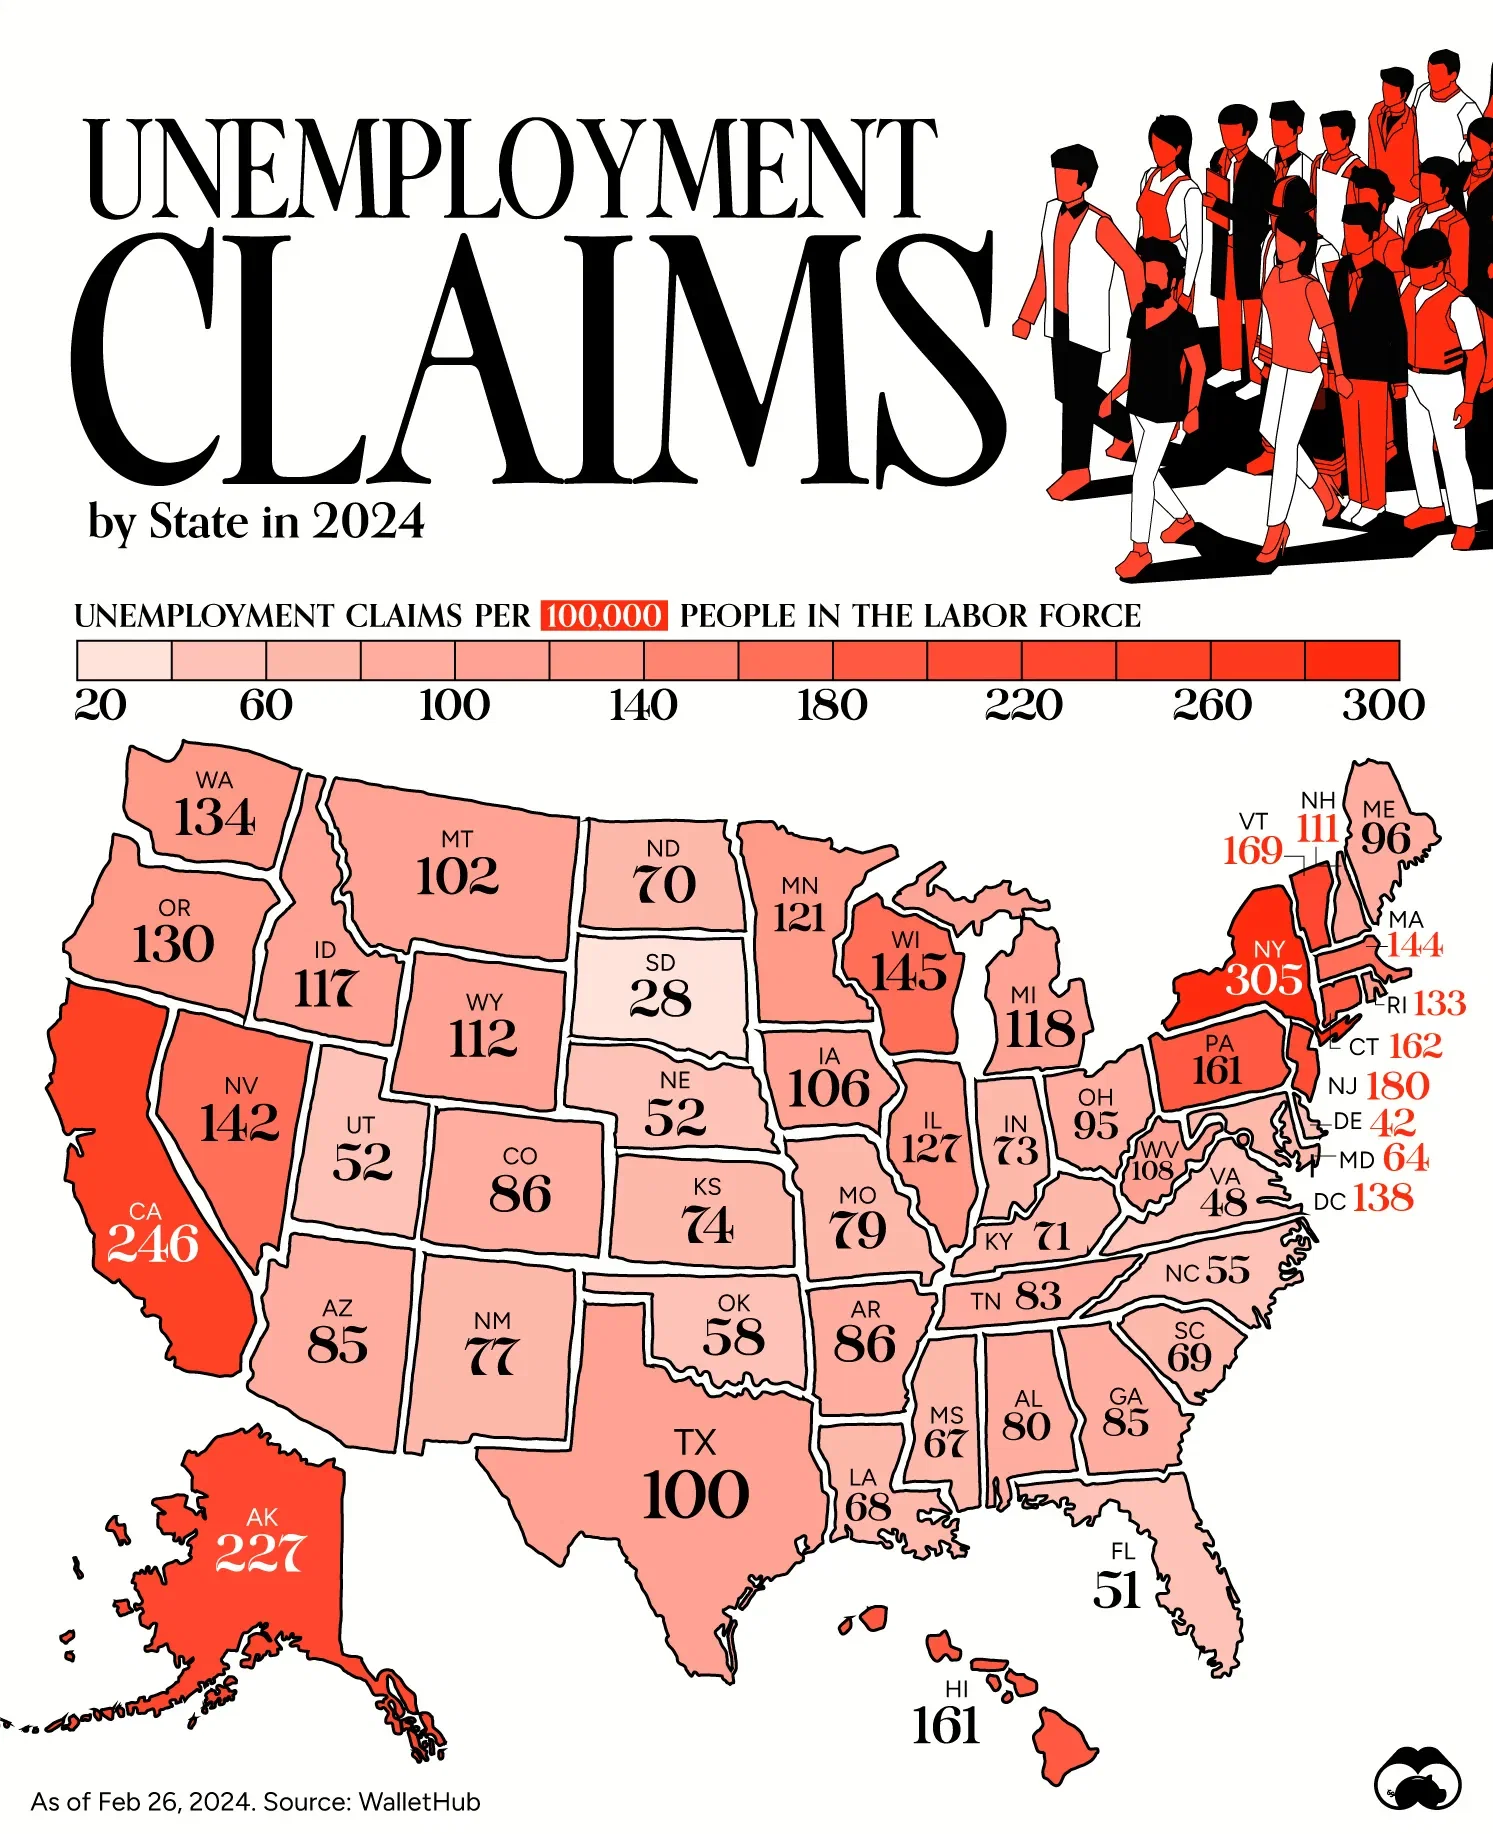
This map graphic visualizes each state’s number of unemployment claims per 100,000 people in the labor force. This data comes from WalletHub, and is as of Feb 26, 2024.
There are roughly 6.1 million Americans unemployed in total, translating to an overall unemployment rate of 3.9%.
States with the largest increases
To see where unemployment is rising the most, we can examine the change in unemployment claims YTD vs the same period of 2023. To specify, this is the period of Jan 1- Feb 26, for 2024 and 2023.
States that saw the biggest rise over this period were: New York (+2,725%), New Jersey (2,132%), and Nevada (505%).
On the other hand, states that saw the biggest decreases were: North Dakota (-98%), New Mexico (-92%), and Nebraska (-75%).
Dataset
State | Unemployment Claims per 100,000 People in the Labor Force | |
---|---|---|
New York | 305 | |
California | 246 | |
Alaska | 227 | |
New Jersey | 180 | |
Vermont | 169 | |
Connecticut | 162 | |
Pennsylvania | 161 | |
Hawaii | 161 | |
Wisconsin | 145 | |
Massachusetts | 144 | |
Nevada | 142 | |
DC | 138 | |
Washington | 134 | |
Rhode Island | 133 | |
Oregon | 130 | |
Illinois | 127 | |
Minnesota | 121 | |
Michigan | 118 | |
Idaho | 117 | |
Wyoming | 112 | |
New Hampshire | 111 | |
West Virginia | 108 | |
Iowa | 106 | |
Montana | 102 | |
Texas | 100 | |
Maine | 96 | |
Ohio | 95 | |
Colorado | 86 | |
Arkansas | 86 | |
Arizona | 85 | |
Georgia | 85 | |
Tennessee | 83 | |
Alabama | 80 | |
Missouri | 79 | |
New Mexico | 77 | |
Kansas | 74 | |
Indiana | 73 | |
Kentucky | 71 | |
North Dakota | 70 | |
South Carolina | 69 | |
Louisiana | 68 | |
Mississippi | 67 | |
Maryland | 64 | |
Oklahoma | 58 | |
North Carolina | 55 | |
Nebraska | 52 | |
Utah | 52 | |
Florida | 51 | |
Virginia | 48 | |
Delaware | 42 | |
South Dakota | 28 |
28
0
11.2K