EconomyJul 14, 2024
How Many Hours Does the Average Person Work in a Year? 💼
What We’re Showing
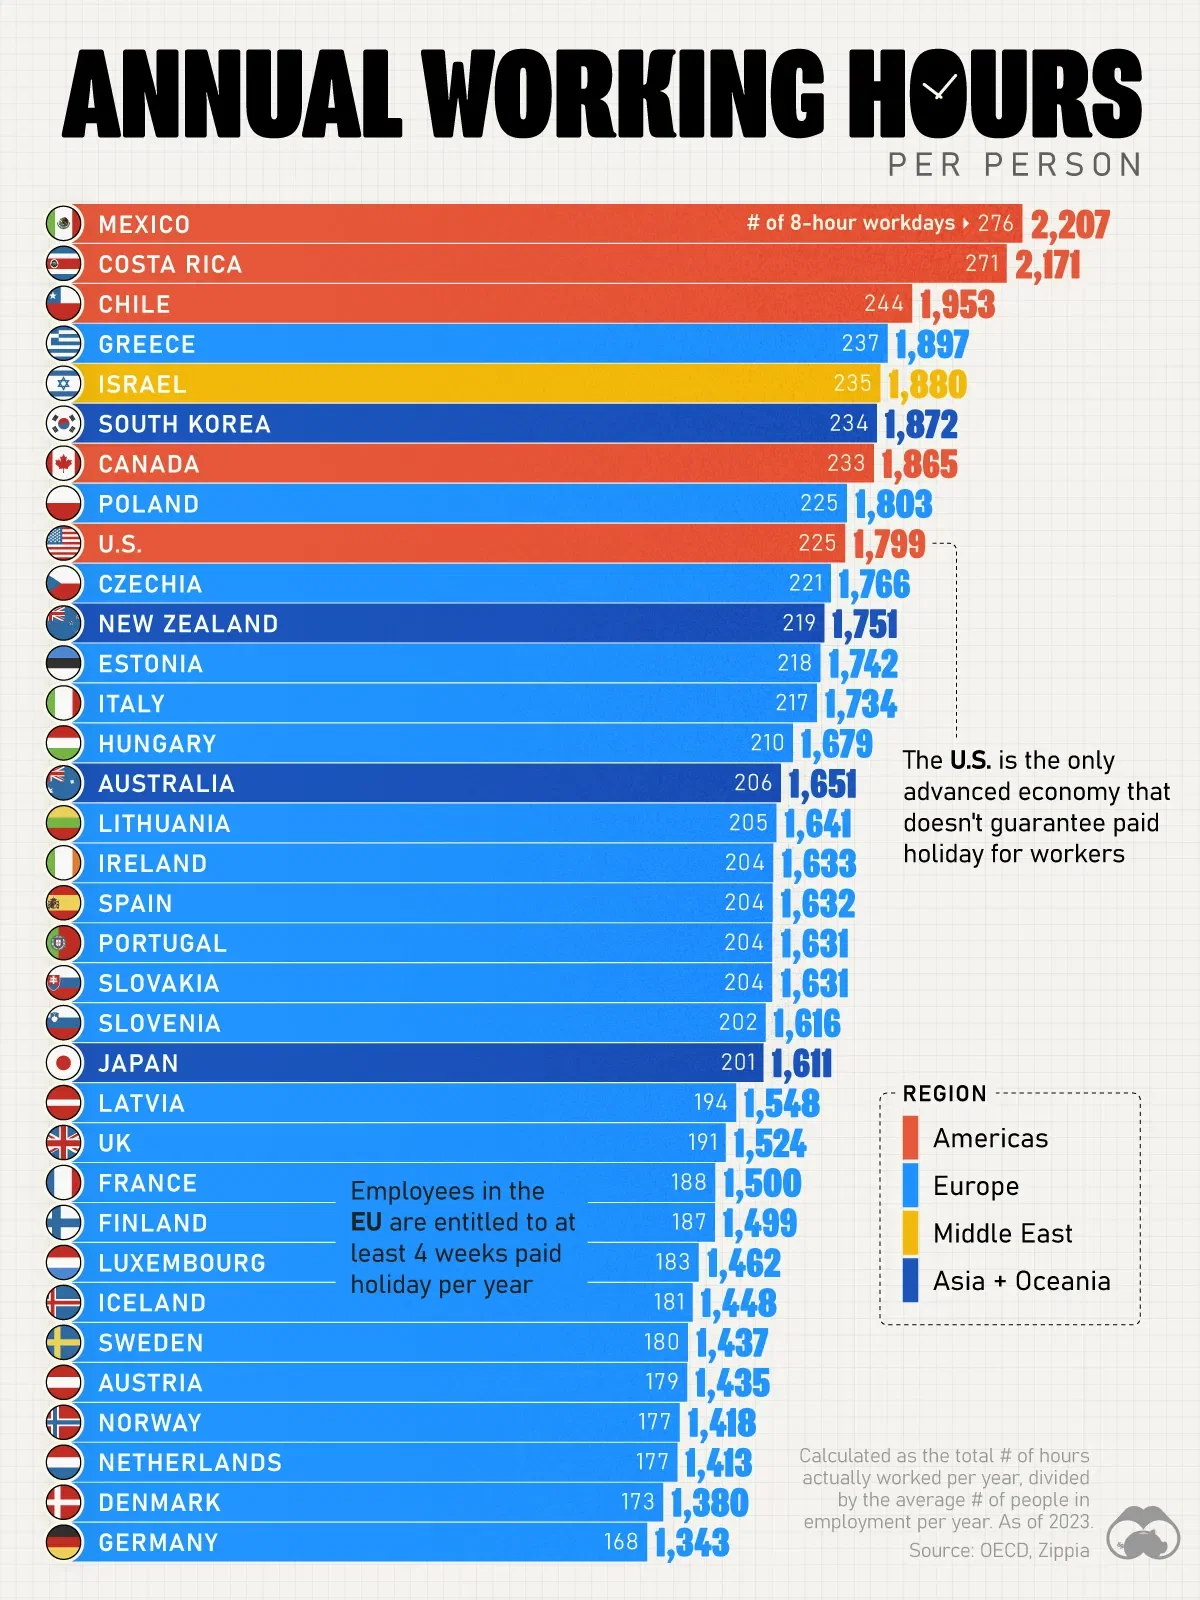
This graphic shows the average annual working hours per person, as of 2023, across OECD nations.
Key Takeaways
- Among OECD member countries, people in Mexico and Costa Rica work the most in a year
- On the other hand, people in Germany work the least (40% less than the average Mexican)
Vacation a Major Factor
One reason for the lower number of hours worked in European countries is the EU's mandate that grants all employees a minimum of 4 weeks paid holiday.
This is a stark contrast to the U.S., which is the only advanced economy that doesn't have a law mandating paid holiday for workers.
Dataset
Country | # of 8-hour workdays | Annual Hours Worked per Person |
---|---|---|
Mexico | 276 | 2207 |
Costa Rica | 271 | 2171 |
Chile | 244 | 1953 |
Greece | 237 | 1897 |
Israel | 235 | 1880 |
Korea | 234 | 1872 |
Canada | 233 | 1865 |
Poland | 225 | 1803 |
U.S. | 225 | 1799 |
Czechia | 221 | 1766 |
New Zealand | 219 | 1751 |
Estonia | 218 | 1742 |
Italy | 217 | 1734 |
Hungary | 210 | 1679 |
Australia | 206 | 1651 |
Lithuania | 205 | 1641 |
Ireland | 204 | 1633 |
Spain | 204 | 1632 |
Portugal | 204 | 1631 |
Slovak Rep. | 204 | 1631 |
Slovenia | 202 | 1616 |
Japan | 201 | 1611 |
Latvia | 194 | 1548 |
UK | 191 | 1524 |
France | 188 | 1500 |
Finland | 187 | 1499 |
Luxembourg | 183 | 1462 |
Iceland | 181 | 1448 |
Sweden | 180 | 1437 |
Austria | 179 | 1435 |
Norway | 177 | 1418 |
Netherlands | 177 | 1413 |
Denmark | 173 | 1380 |
Germany | 168 | 1343 |
117
0
119.7K