EconomyApr 15, 2024
How Debt-to-GDP Ratios Have Changed Since 2000 🔎
What we’re showing
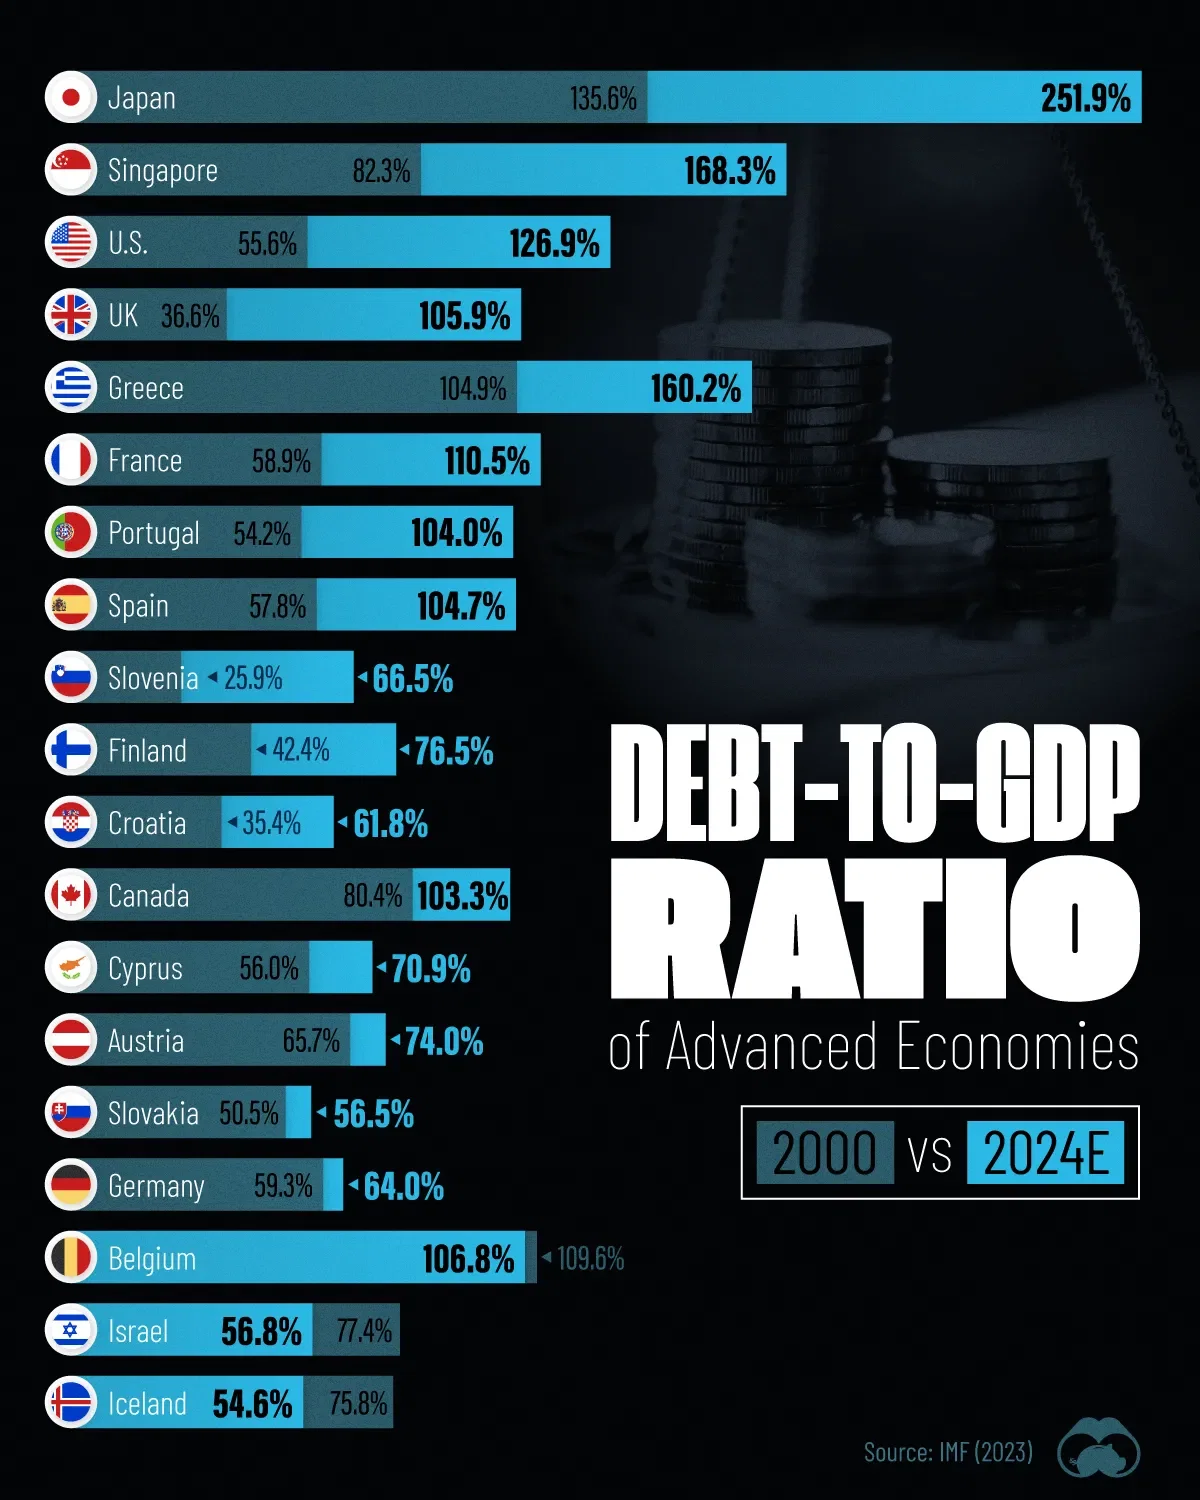
The gross debt-to-GDP ratio of advanced economies, for 2000 and 2024 (estimated). All figures come from the IMF’s latest World Economic Outlook.
Government gross debt in this context consists of all liabilities that require payment or payments of interest and/or principal in the future.
Countries with the biggest increases
Japan (+116 pp), Singapore (+86 pp), and the U.S. (+71 pp) have grown their debt as a % of GDP the most since the year 2000.
Only 3 countries saw declines
Belgium (-2.8 pp), Iceland (-21.2 pp), and Israel (-20.6 pp) were the only countries that have decreased their debt-to-GDP ratios since the year 2000.
Dataset
Country | 2000 | 2024 | Change in pp |
---|---|---|---|
Japan | 135.6 | 251.9 | 116.3 |
Singapore | 82.3 | 168.3 | 86.0 |
United States | 55.6 | 126.9 | 71.3 |
United Kingdom | 36.6 | 105.9 | 69.3 |
Greece | 104.9 | 160.2 | 55.3 |
France | 58.9 | 110.5 | 51.6 |
Portugal | 54.2 | 104.0 | 49.8 |
Spain | 57.8 | 104.7 | 46.9 |
Slovenia | 25.9 | 66.5 | 40.6 |
Finland | 42.4 | 76.5 | 34.1 |
Croatia | 35.4 | 61.8 | 26.4 |
Canada | 80.4 | 103.3 | 22.9 |
Cyprus | 56.0 | 70.9 | 14.9 |
Austria | 65.7 | 74.0 | 8.3 |
Slovak Republic | 50.5 | 56.5 | 6.0 |
Germany | 59.3 | 64.0 | 4.7 |
Belgium | 109.6 | 106.8 | -2.8 |
Israel | 77.4 | 56.8 | -20.6 |
Iceland | 75.8 | 54.6 | -21.2 |
57
0
22.2K