Where Data Tells the Story
© Voronoi 2026. All rights reserved.
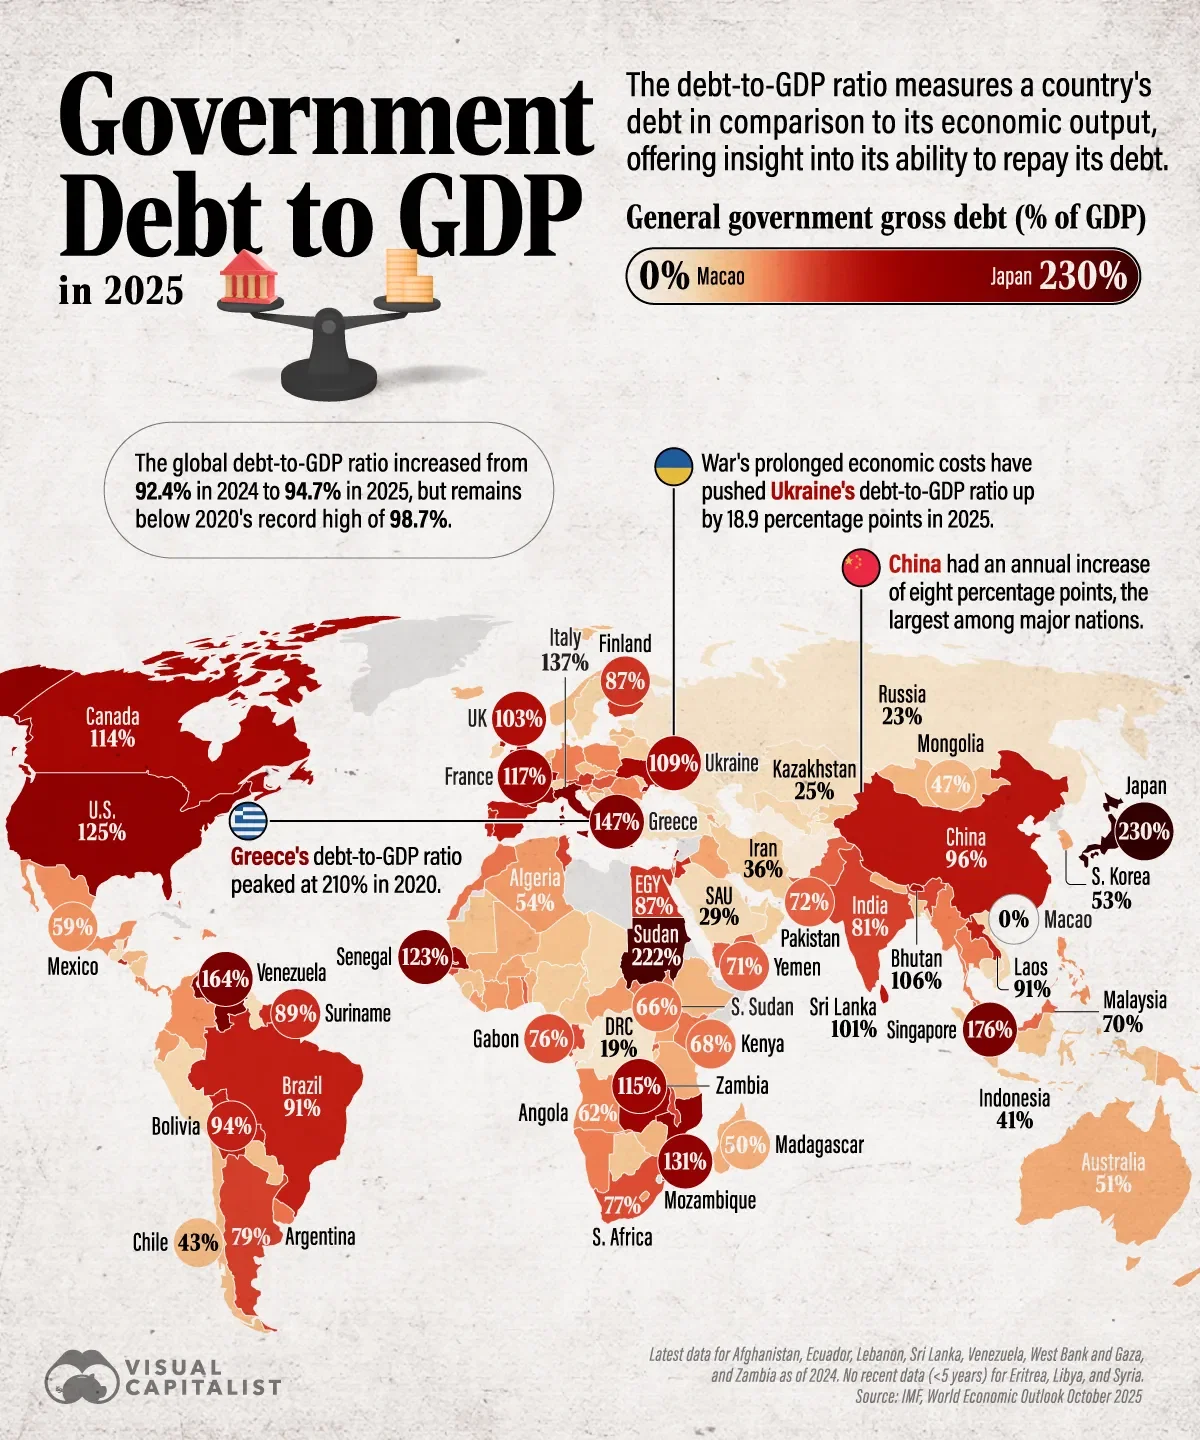
This map visualizes the general government gross debt as a percentage of GDP in 2025, comparing how heavily indebted countries are relative to their economic output.
The data comes from the IMF World Economic Outlook (October 2025) and covers over 190 countries, ranging from Macao at 0% to Japan at 230%.
See our full article here.