EconomyAug 11, 2024
Global Debt Hits a New High of $315 Trillion 🏦
What We’re Showing
This graphic shows global debt as of Q1 2024, based on data from the Institute of International Finance (IIF).
Key Takeaways
- The global debt stock hit a fresh high in the first quarter of 2024, reaching 333% of GDP
- Roughly two-thirds of global debt is driven by advanced economies
- In advanced markets, the U.S. and Japan were the largest contributors to debt in Q1 while China, India, and Mexico made up the greatest share across emerging markets
- Overall, global debt has expanded by more than $100 trillion in the last decade
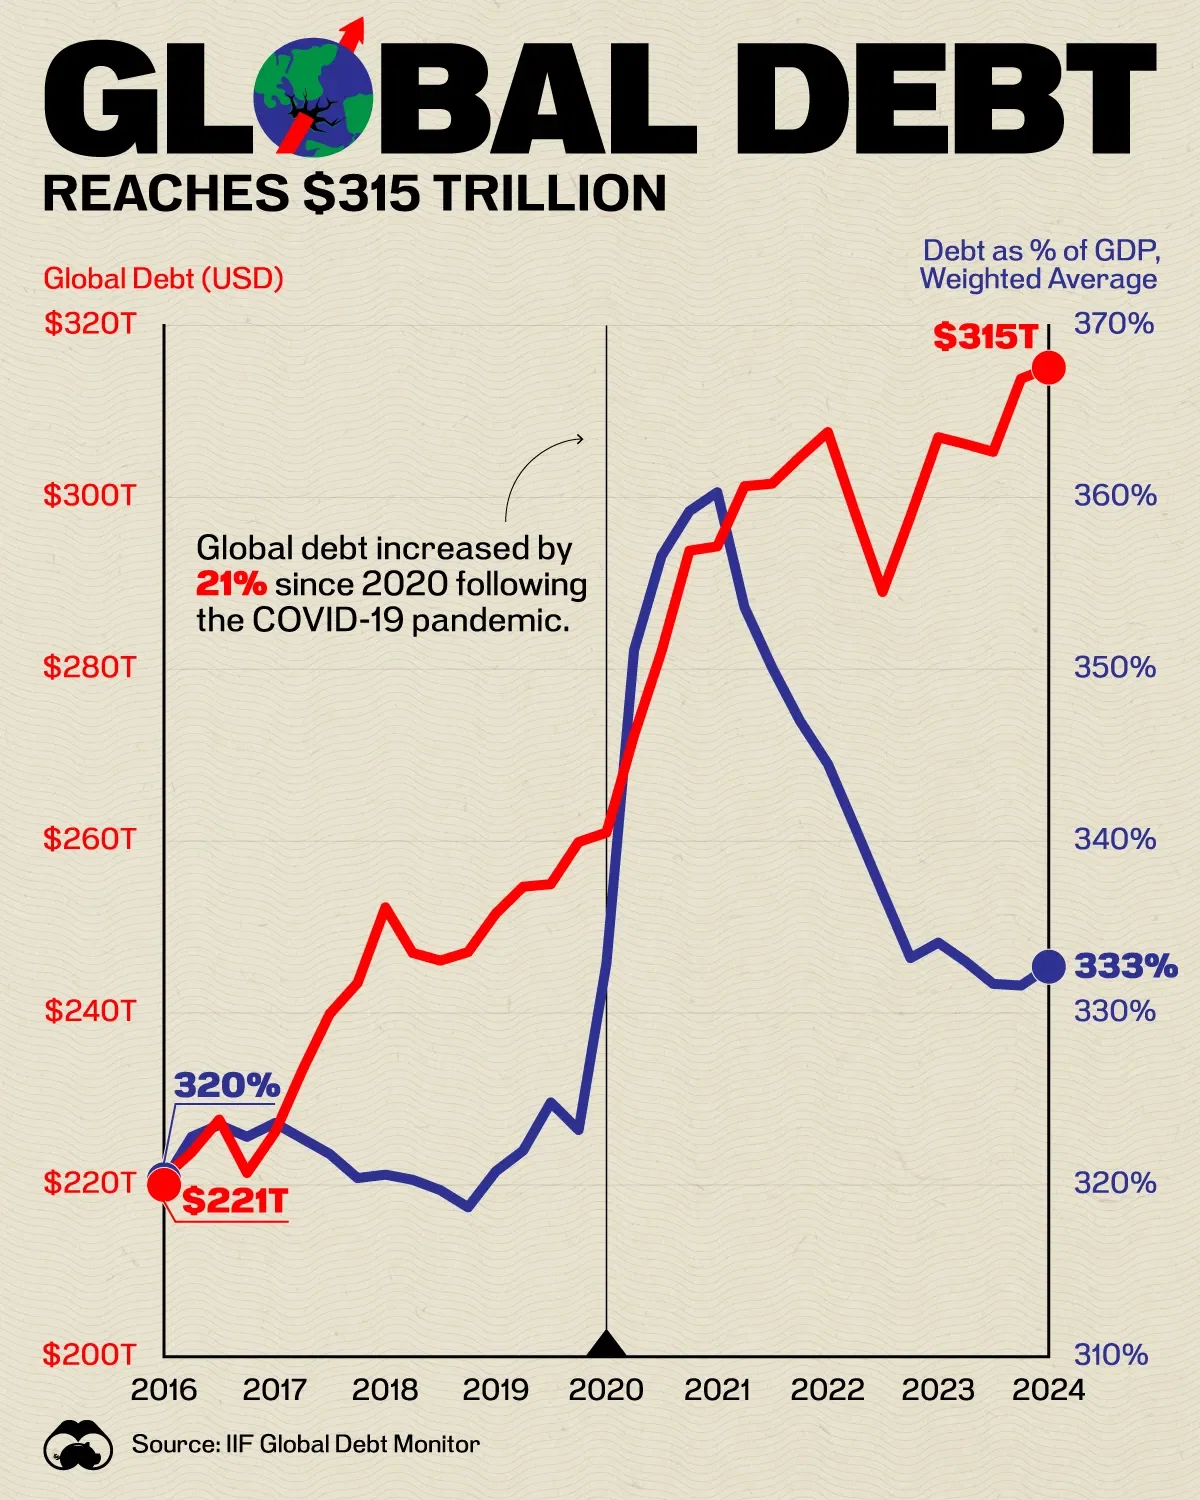
Dataset
Global Debt (USD) | Debt as % of GDP, Weighted Average | |
---|---|---|
2024 Q1 | 315.1 | 332.7 |
2023 Q4 | 313.8 | 331.6 |
2023 Q3 | 305.3 | 331.7 |
2023 Q2 | 306.2 | 333.0 |
2023 Q1 | 307.0 | 334.1 |
2022 Q4 | 297.8 | 333.2 |
2022 Q3 | 289.0 | 337.0 |
2022 Q2 | 298.2 | 340.8 |
2022 Q1 | 307.6 | 344.5 |
2021 Q4 | 304.7 | 347.0 |
2021 Q3 | 301.6 | 350.1 |
2021 Q2 | 301.3 | 353.6 |
2021 Q1 | 294.3 | 360.3 |
2020 Q4 | 293.8 | 359.2 |
2020 Q3 | 282.1 | 356.6 |
2020 Q2 | 272.3 | 351.1 |
2020 Q1 | 261.0 | 332.9 |
2019 Q4 | 259.9 | 323.2 |
2019 Q3 | 255.0 | 324.8 |
2019 Q2 | 254.7 | 322.0 |
2019 Q1 | 251.6 | 320.8 |
2018 Q4 | 247.1 | 318.7 |
2018 Q3 | 246.1 | 319.7 |
2018 Q2 | 247.0 | 320.3 |
2018 Q1 | 252.3 | 320.6 |
2017 Q4 | 243.5 | 320.4 |
2017 Q3 | 239.9 | 321.8 |
2017 Q2 | 233.3 | 322.7 |
2017 Q1 | 226.1 | 323.6 |
2016 Q4 | 221.4 | 322.8 |
2016 Q3 | 227.6 | 323.5 |
2016 Q2 | 223.8 | 322.8 |
2016 Q1 | 220.9 | 320.2 |
123
0
34.2K