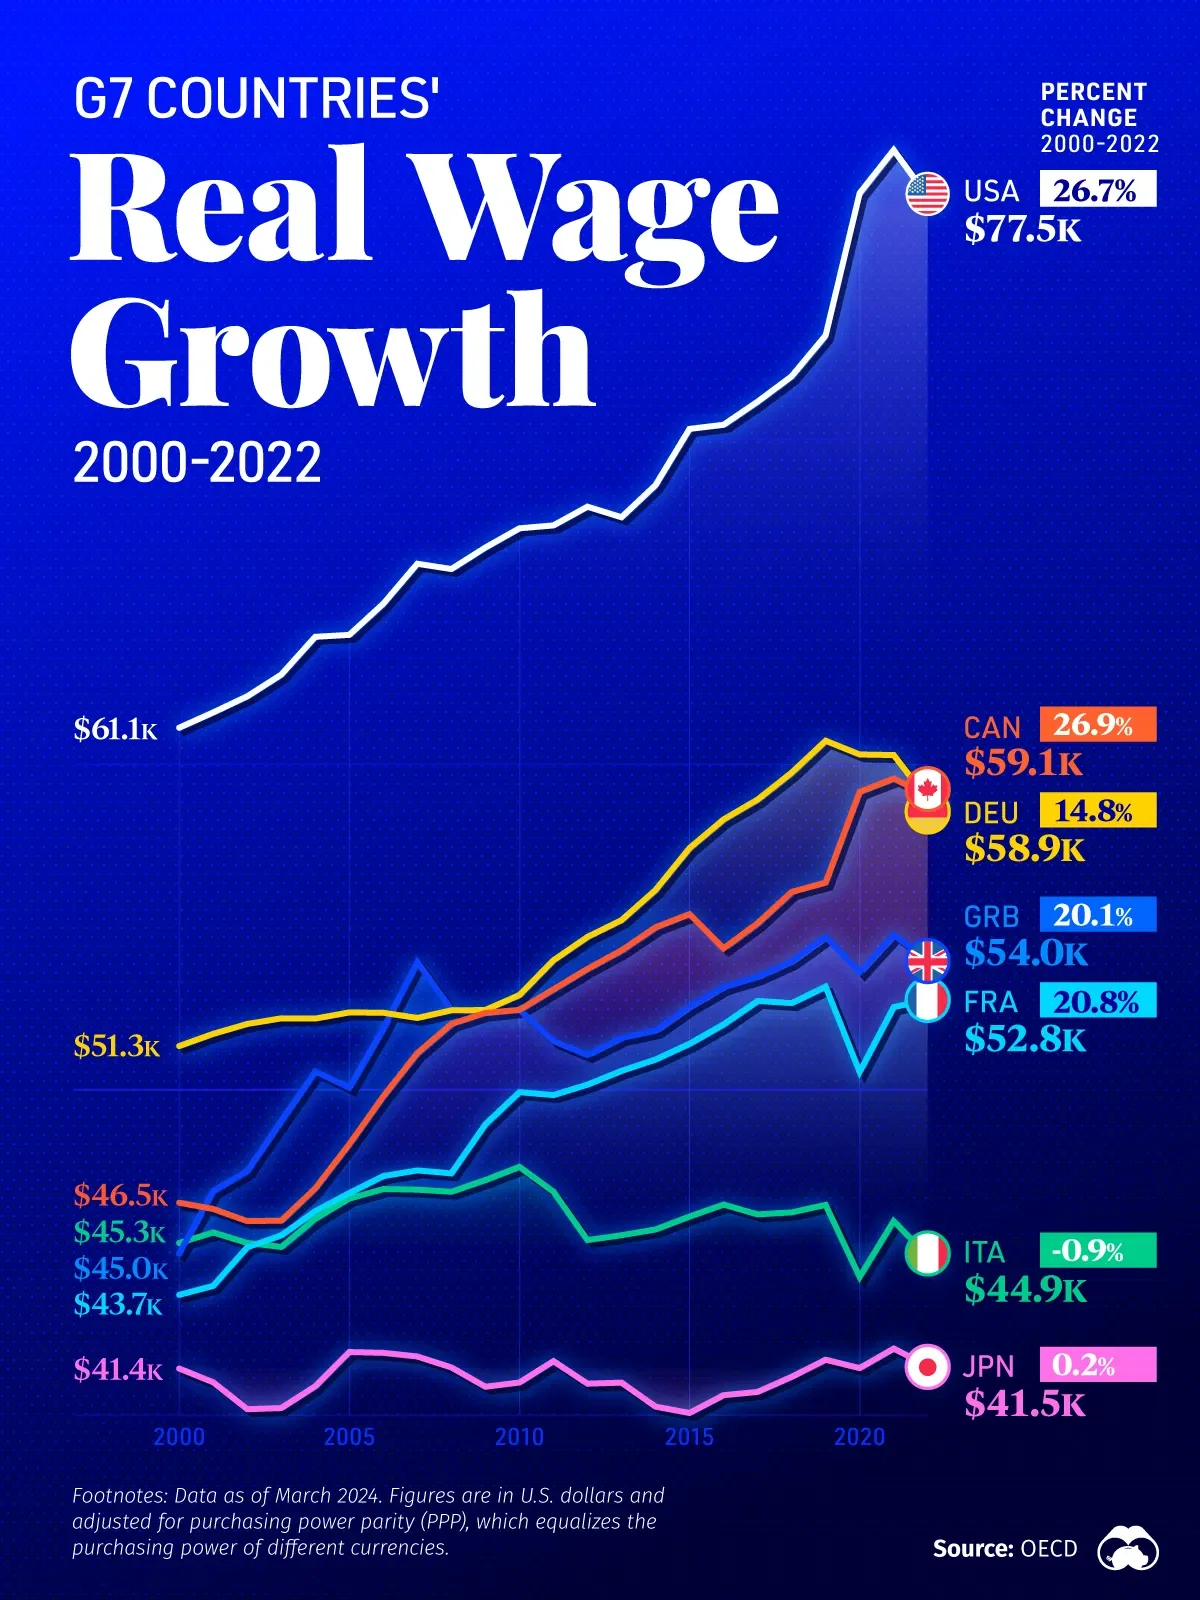
G7 Countries’ Real Wage Growth from 2000 to 2022
What We’re Showing
The average annual real wage growth for full-time workers of G7 countries from 2000 to 2022. Data comes from the OECD and is updated as of March 2024. Figures are in U.S. dollars and are adjusted for purchasing power parity (PPP), which equalizes the purchasing power of different currencies.
Simply put, real wage growth refers to how much wages increase after taking inflation into account.
Japan and Italy Lag Behind
Italy is the only G7 country that saw its average annual wage in 2022 fall below what it was over 20 years ago. With prolonged periods of economic stagnation and a large share of small to medium companies that tend to pay lower wages compared to large firms, Italy is falling behind other advanced economies.
However, Japan has consistently had the lowest average annual wage among all G7 countries since 2000. Japan's stagnant wages can be attributed to long periods of deflation, a corporate focus on maintaining employment over raising wages, and a strong emphasis on seniority-based pay and lifetime employment.
Dataset
Year | Canada | France | Germany | Italy | Japan | United Kingdom | United States |
---|---|---|---|---|---|---|---|
2000 | $46,526.34 | $43,694.35 | $51,344.10 | $45,289.58 | $41,428.24 | $44,967.09 | $61,131.60 |
2001 | $46,335.18 | $43,969.03 | $51,718.80 | $45,612.84 | $41,006.37 | $46,885.64 | $61,601.24 |
2002 | $45,961.56 | $45,155.67 | $52,022.68 | $45,290.10 | $40,178.30 | $47,505.08 | $62,096.63 |
2003 | $45,975.75 | $45,524.23 | $52,195.61 | $45,168.01 | $40,212.77 | $49,042.43 | $62,764.10 |
2004 | $46,969.12 | $46,266.46 | $52,188.86 | $46,032.26 | $40,884.39 | $50,561.33 | $63,927.41 |
2005 | $48,325.74 | $46,823.79 | $52,377.65 | $46,654.25 | $41,936.10 | $50,067.25 | $63,987.32 |
2006 | $49,797.00 | $47,347.00 | $52,367.00 | $46,947.00 | $41,911.00 | $51,890.00 | $64,945.00 |
2007 | $51,127.00 | $47,520.00 | $52,208.00 | $46,928.00 | $41,799.00 | $53,926.00 | $66,174.00 |
2008 | $52,025.00 | $47,429.00 | $52,442.00 | $46,864.00 | $41,463.00 | $52,475.00 | $66,011.00 |
2009 | $52,363.00 | $48,938.00 | $52,453.00 | $47,224.00 | $40,869.00 | $52,346.00 | $66,673.00 |
2010 | $52,457.00 | $49,926.00 | $52,912.00 | $47,629.00 | $40,999.00 | $52,455.00 | $67,263.00 |
2011 | $53,088.00 | $49,836.00 | $53,980.00 | $46,866.00 | $41,656.00 | $51,497.00 | $67,353.00 |
2012 | $53,717.00 | $50,159.00 | $54,699.00 | $45,379.00 | $40,963.00 | $51,070.00 | $67,928.00 |
2013 | $54,286.00 | $50,581.00 | $55,215.00 | $45,527.00 | $40,995.00 | $51,594.00 | $67,604.00 |
2014 | $54,995.00 | $50,929.00 | $56,141.00 | $45,704.00 | $40,257.00 | $51,816.00 | $68,591.00 |
2015 | $55,400.00 | $51,415.00 | $57,431.00 | $46,103.00 | $40,062.00 | $52,549.00 | $70,320.00 |
2016 | $54,350.00 | $52,010.00 | $58,311.00 | $46,469.00 | $40,609.00 | $53,156.00 | $70,446.00 |
2017 | $55,122.00 | $52,732.00 | $58,924.00 | $46,169.00 | $40,710.00 | $53,471.00 | $71,157.00 |
2018 | $56,083.00 | $52,664.00 | $59,750.00 | $46,230.00 | $41,172.00 | $53,950.00 | $71,937.00 |
2019 | $56,370.00 | $53,172.00 | $60,732.00 | $46,460.00 | $41,699.00 | $54,703.00 | $73,194.00 |
2020 | $59,160.00 | $50,550.00 | $60,309.00 | $44,246.00 | $41,442.00 | $53,612.00 | $77,567.00 |
2021 | $59,568.78 | $52,542.19 | $60,291.24 | $45,960.65 | $42,041.31 | $54,762.30 | $78,894.28 |
2022 | $59,050.41 | $52,763.59 | $58,940.33 | $44,893.33 | $41,509.20 | $53,985.06 | $77,463.47 |
Percent change (2000 to 2022) | 26.9% | 20.8% | 14.8% | -0.9% | 0.2% | 20.1% | 26.7% |