Where Data Tells the Story
© Voronoi 2026. All rights reserved.

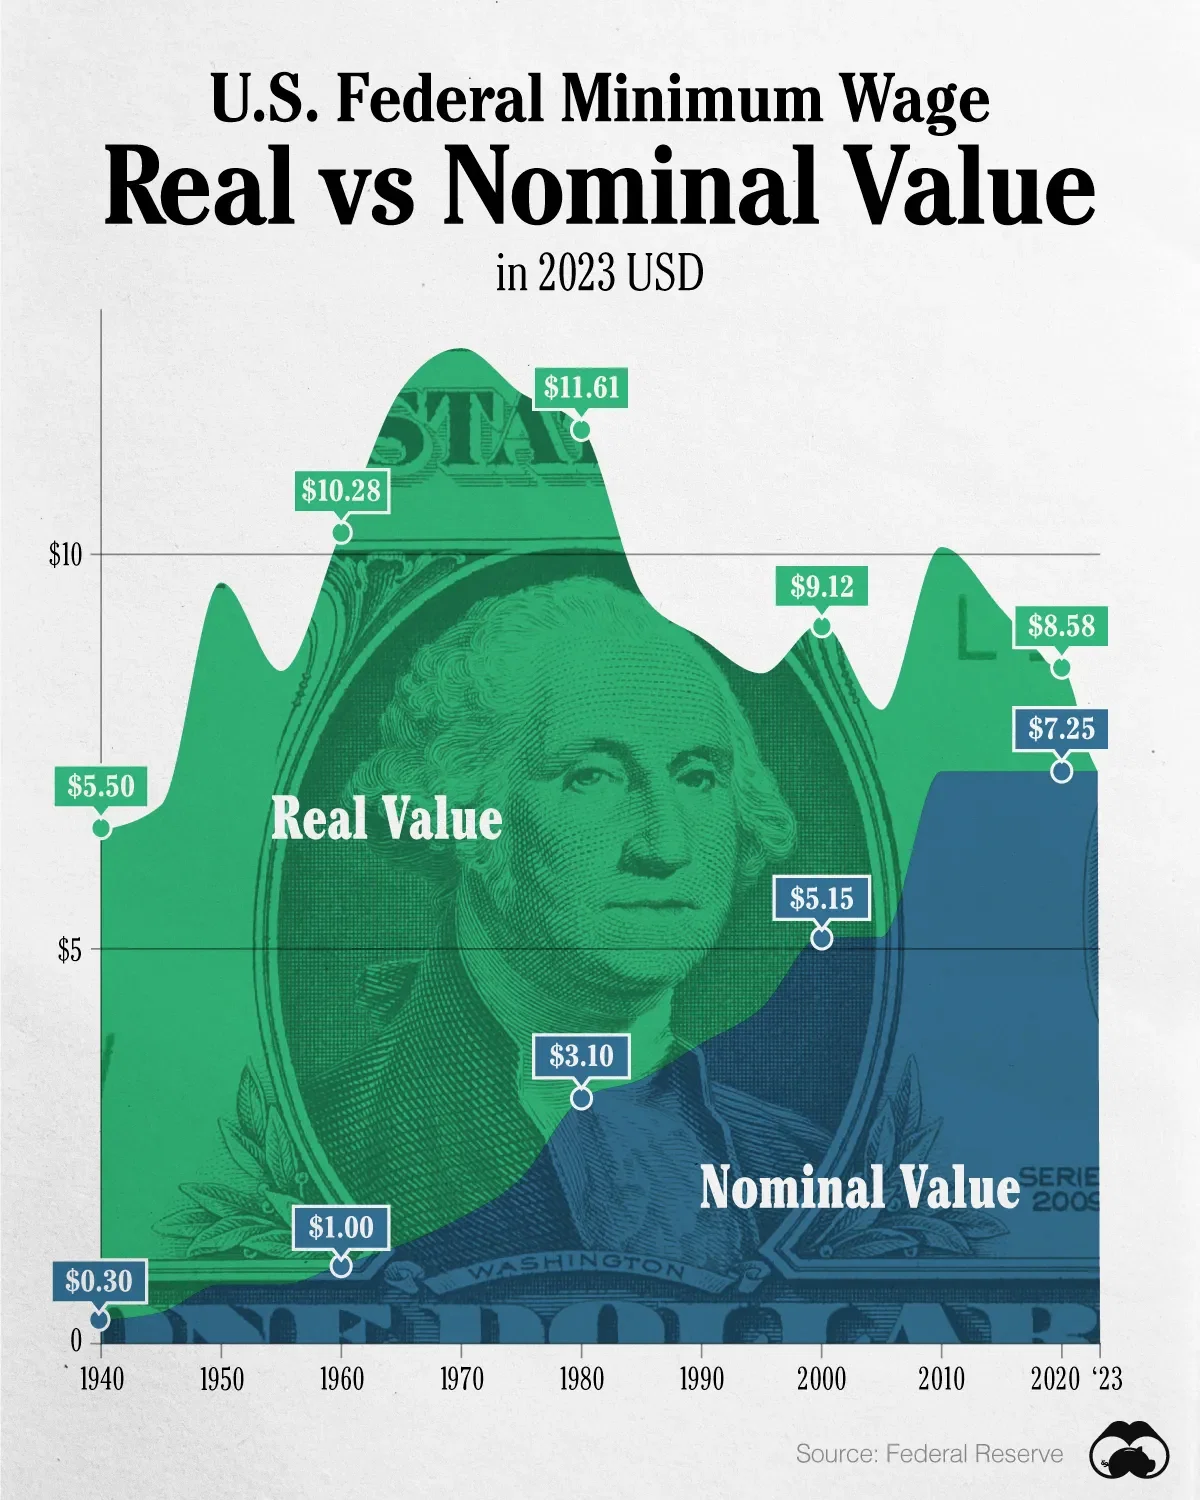
The U.S. federal minimum wage, both in nominal and real (inflation-adjusted) terms. The federal minimum wage was raised to $7.25 per hour in July 2009, where it has remained since.
Consider the year 1960, where the federal minimum wage (nominal value) was $1 per hour. In today’s prices (real value), this would have been worth $10.28.
From the chart, we can see that the value of the minimum wage peaked in the 1970s, despite numerous nominal increases.
At 2023, the two lines converge because the nominal and real value are identical in present day terms.
According to the National Conference of State Legislatures (NCSL), 30 states and Washington, D.C. have implemented a minimum wage that is higher than $7.25.
The following states still follow the $7.25 federal minimum: Georgia, Idaho, Indiana, Iowa, Kansas, Kentucky, New Hampshire, North Carolina, North Dakota, Oklahoma, Pennsylvania, Texas, Utah, Wisconsin, and Wyoming.