Where Data Tells the Story
© Voronoi 2026. All rights reserved.

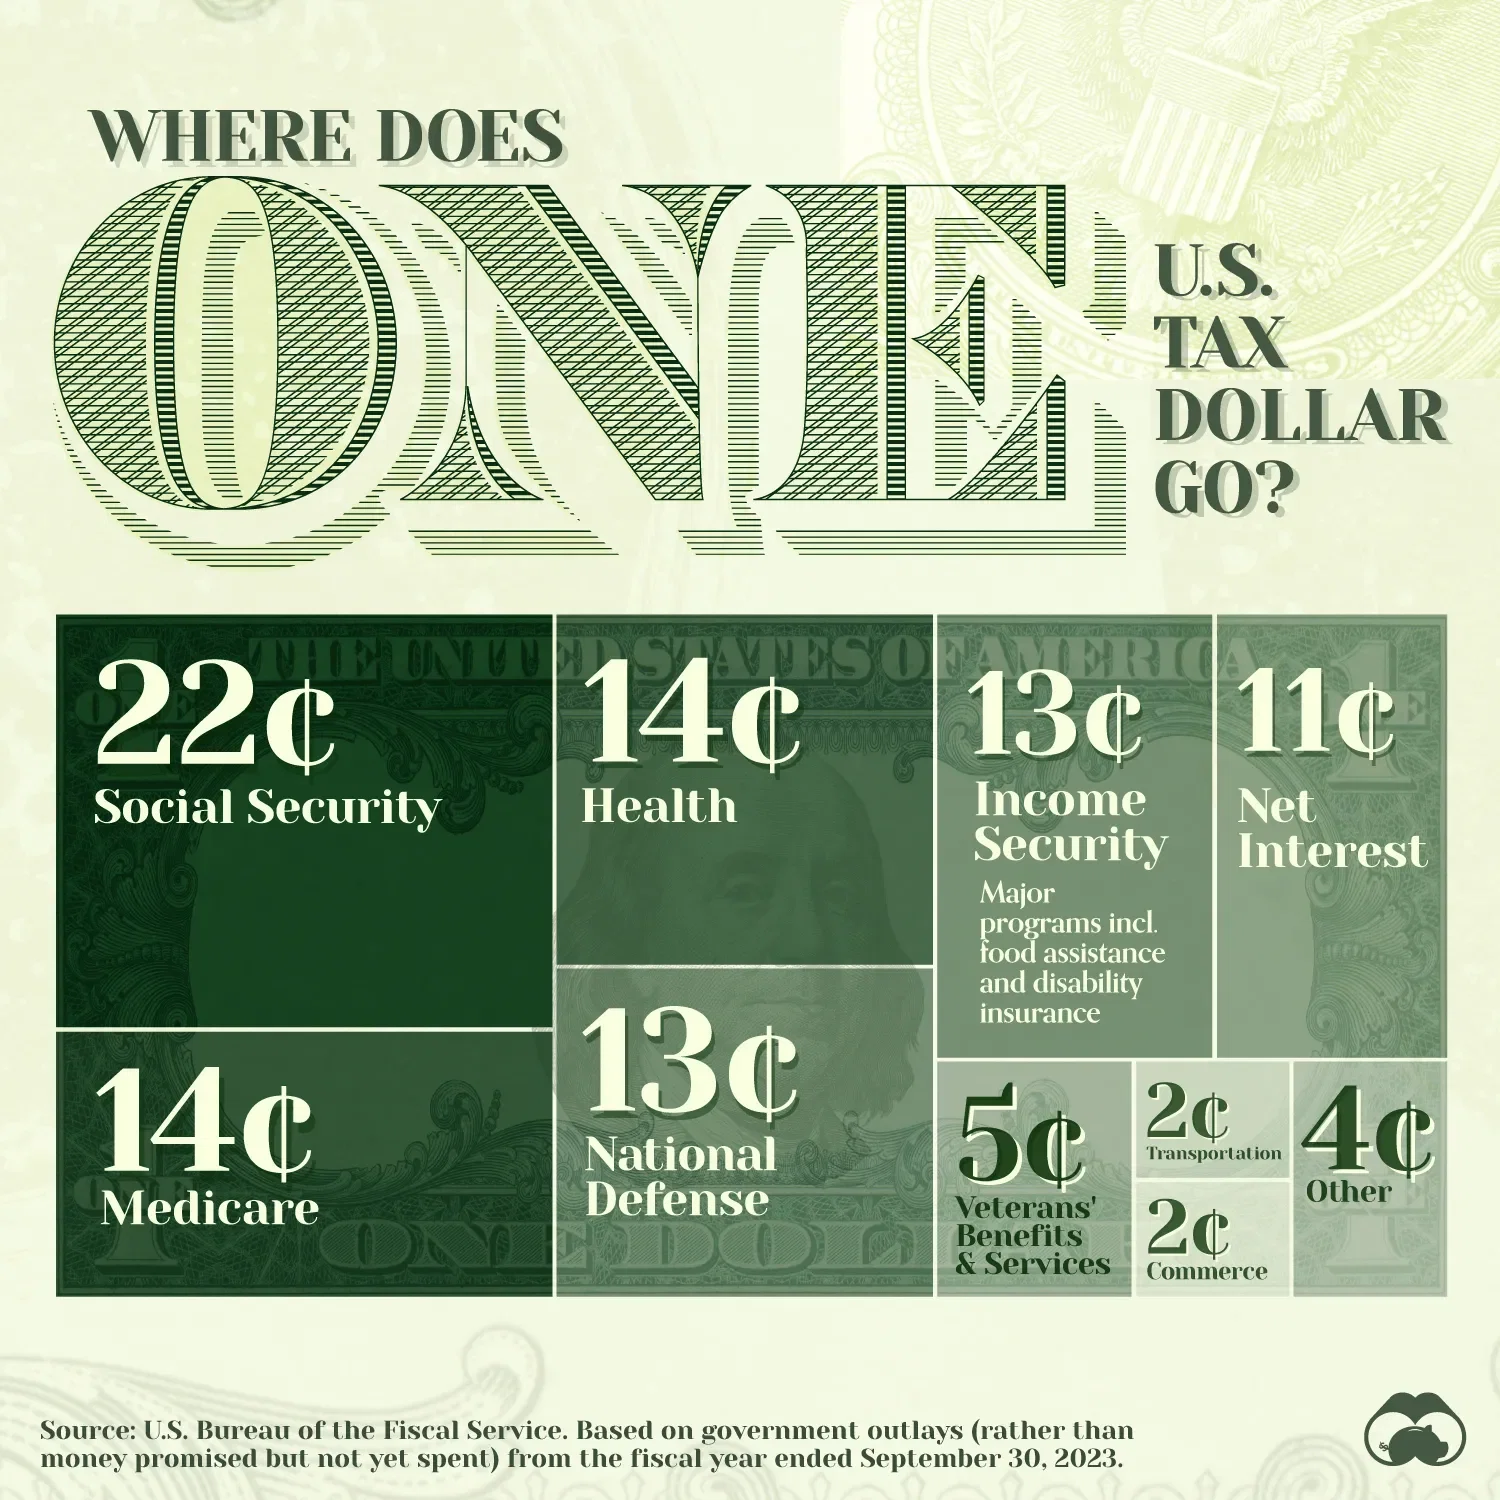
A breakdown of U.S. federal government spending by function. Data is for the fiscal year ending September 30, 2023 based on data from the U.S. Bureau of the Fiscal Service. We used total spending amounts and converted them to percentages in order to show where one tax dollar goes.
Social security is the government’s single largest expense and where 22% of tax dollars go. The program is designed to provide a source of income for retirees, or for people who cannot work due to a disability, as early as age 62.
Health and Medicare combined amount to 28% of government spending. The largest health expense is grants to states for Medicaid, which helps cover medical costs for people with lower incomes. Medicare, on the other hand, is federal health insurance for people 65 and older.
National Defense accounts for 13% of government spending. This primarily includes paying for military personnel, operating and maintenance costs like fuel, buying assets like aircraft and ships, and research and development.