
Where Data Tells the Story
© Voronoi 2026. All rights reserved.

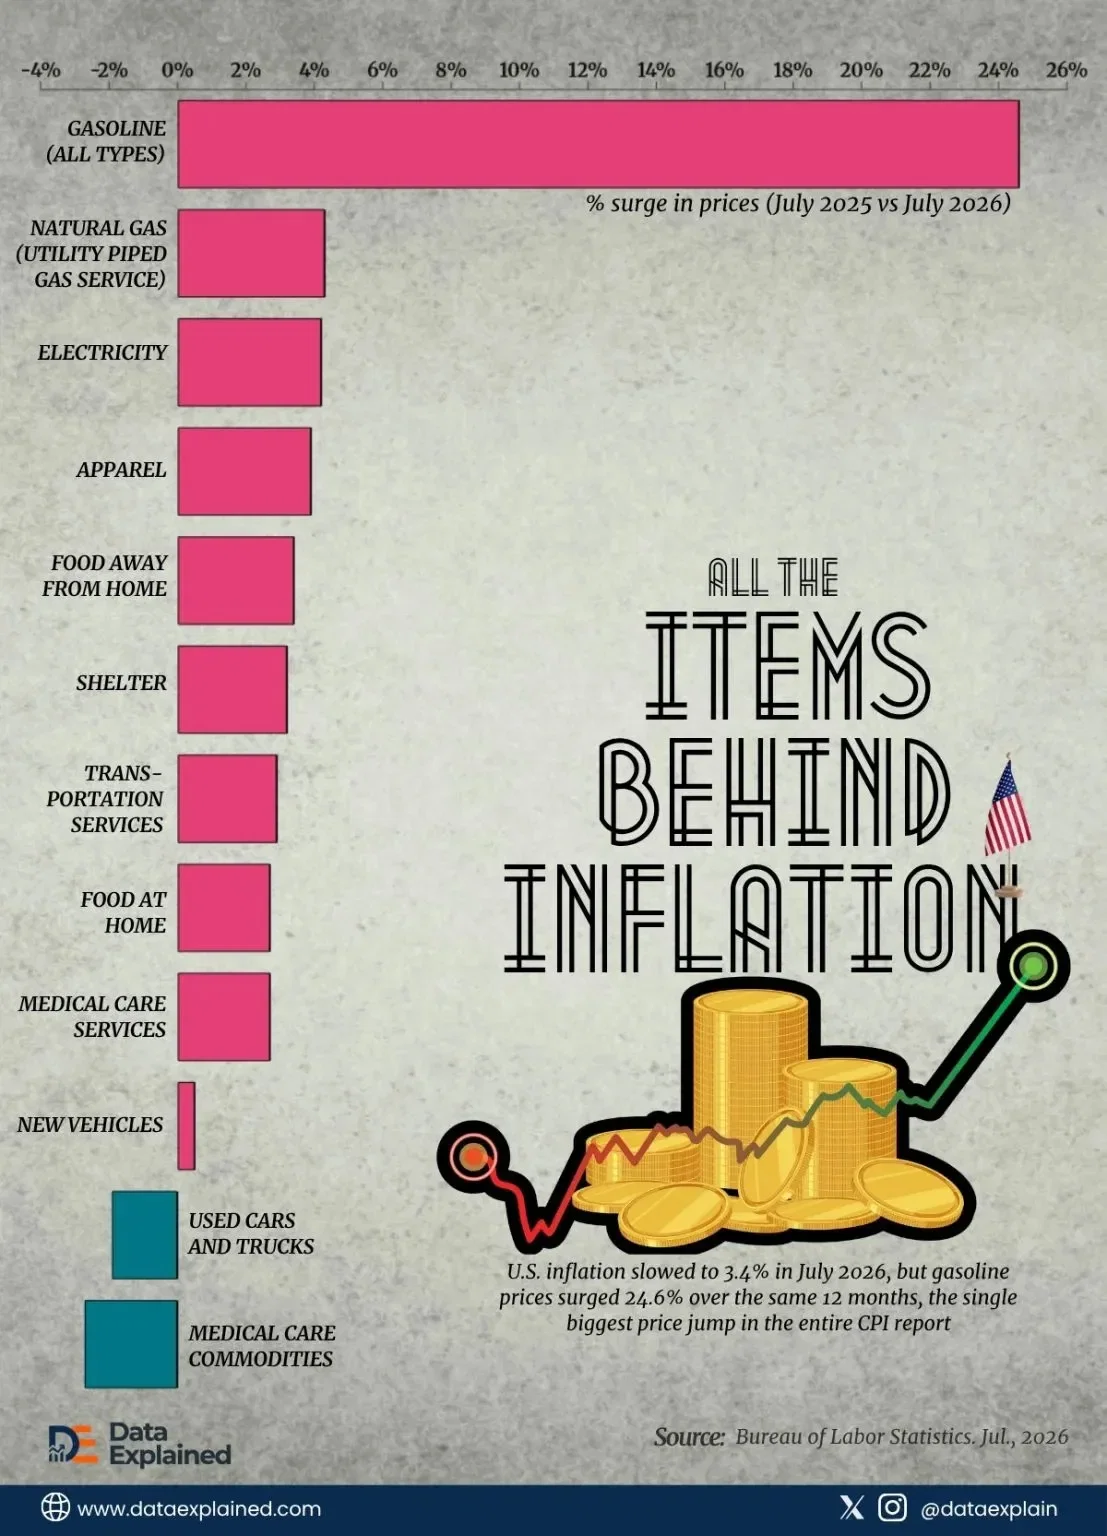
American inflation is cooling. Prices rose 3.4% over the 12 months ended July 2026, down from 3.5% the month before.
The U.S. Consumer Price Index (CPI) groups everything people buy into 12 major categories to track how prices change over time.
In the visualization above, we rank the 12 major buckets by their percentage surge over the last year.
It is based on the latest data from the Bureau of Labor Statistics.
For most things people buy, the worst of the inflation era genuinely appears to be fading. Only gas prices saw the steepest jump.
Outside of energy, the picture is noticeably calmer.
None of these numbers are painless, but they are all at levels far more manageable than those Americans were experiencing two years ago.