EconomyMay 14, 2024
A Decade of Inflation Across Fast Food Chains
What We’re Showing
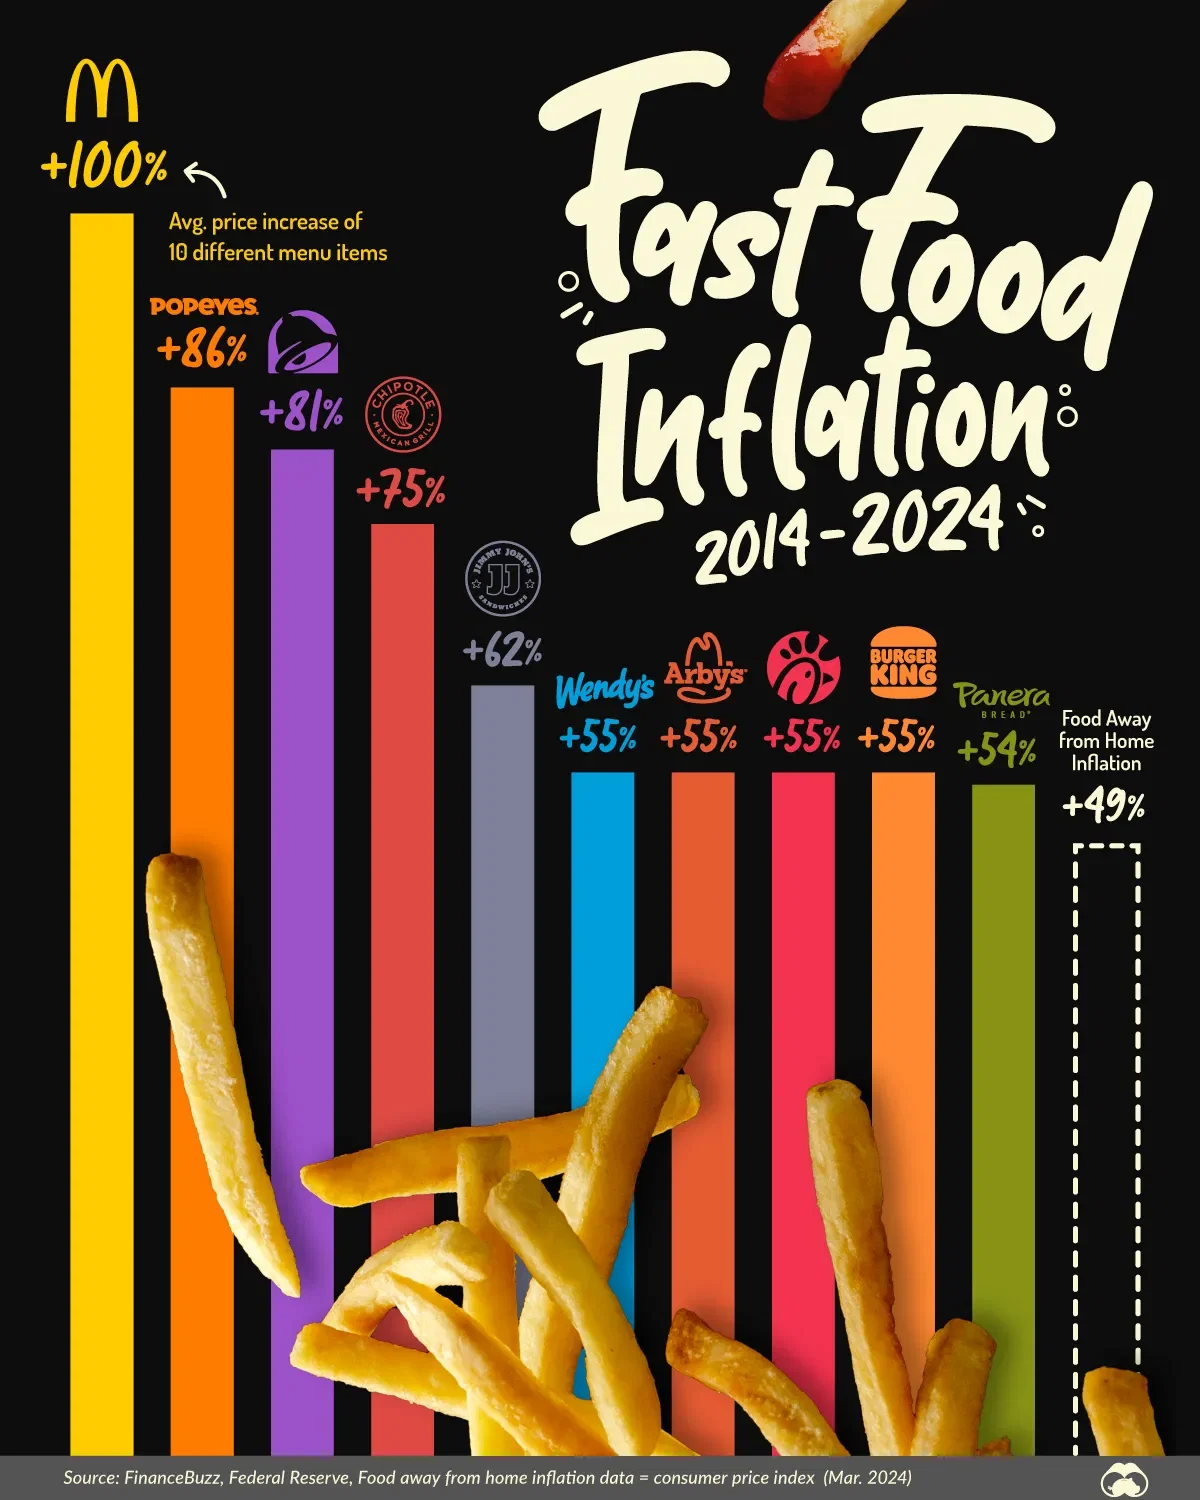
The average price increase of 10 menu items of 10 American fast food chains, as well as the U.S. city average consumer price index for food away from home, from 2014 to 2024. Fast food chain data comes from Finance Buzz and the food away from home inflation figure comes from the Federal Reserve’s March 2024 Consumer Price Index.
The Rising Costs of Dining Out
- On average, eating at these 10 fast food restaurants has gotten 63% more expensive since 2014.
- McDonalds takes the inflationary cake, with its average prices across 10 items doubling since 2014.
- In general, eating out in most U.S. cities is now 48.5% more expensive than 10 years ago, according to Consumer Price Index data.
Dataset
Restaurant | Average price increase of 10 different menu items (2014-2024) |
---|---|
McDonald's | 100% |
Popeye's | 86% |
Taco Bell | 81% |
Chipotle | 75% |
Jimmy John's | 62% |
Wendy's | 55% |
Arby's | 55% |
Chick-fil-A | 55% |
Burger King | 55% |
Panera Bread | 54% |
Food Away from Home Inflation | 48.5% |
Starbucks | 39% |
Subway | 39% |
Data sources
Price data was gathered for the same 10 menu items over time. Food away from home inflation data is of the consumer price index since January 2014 through to March 2024.
88
0
25.7K