EconomyAug 19, 2024
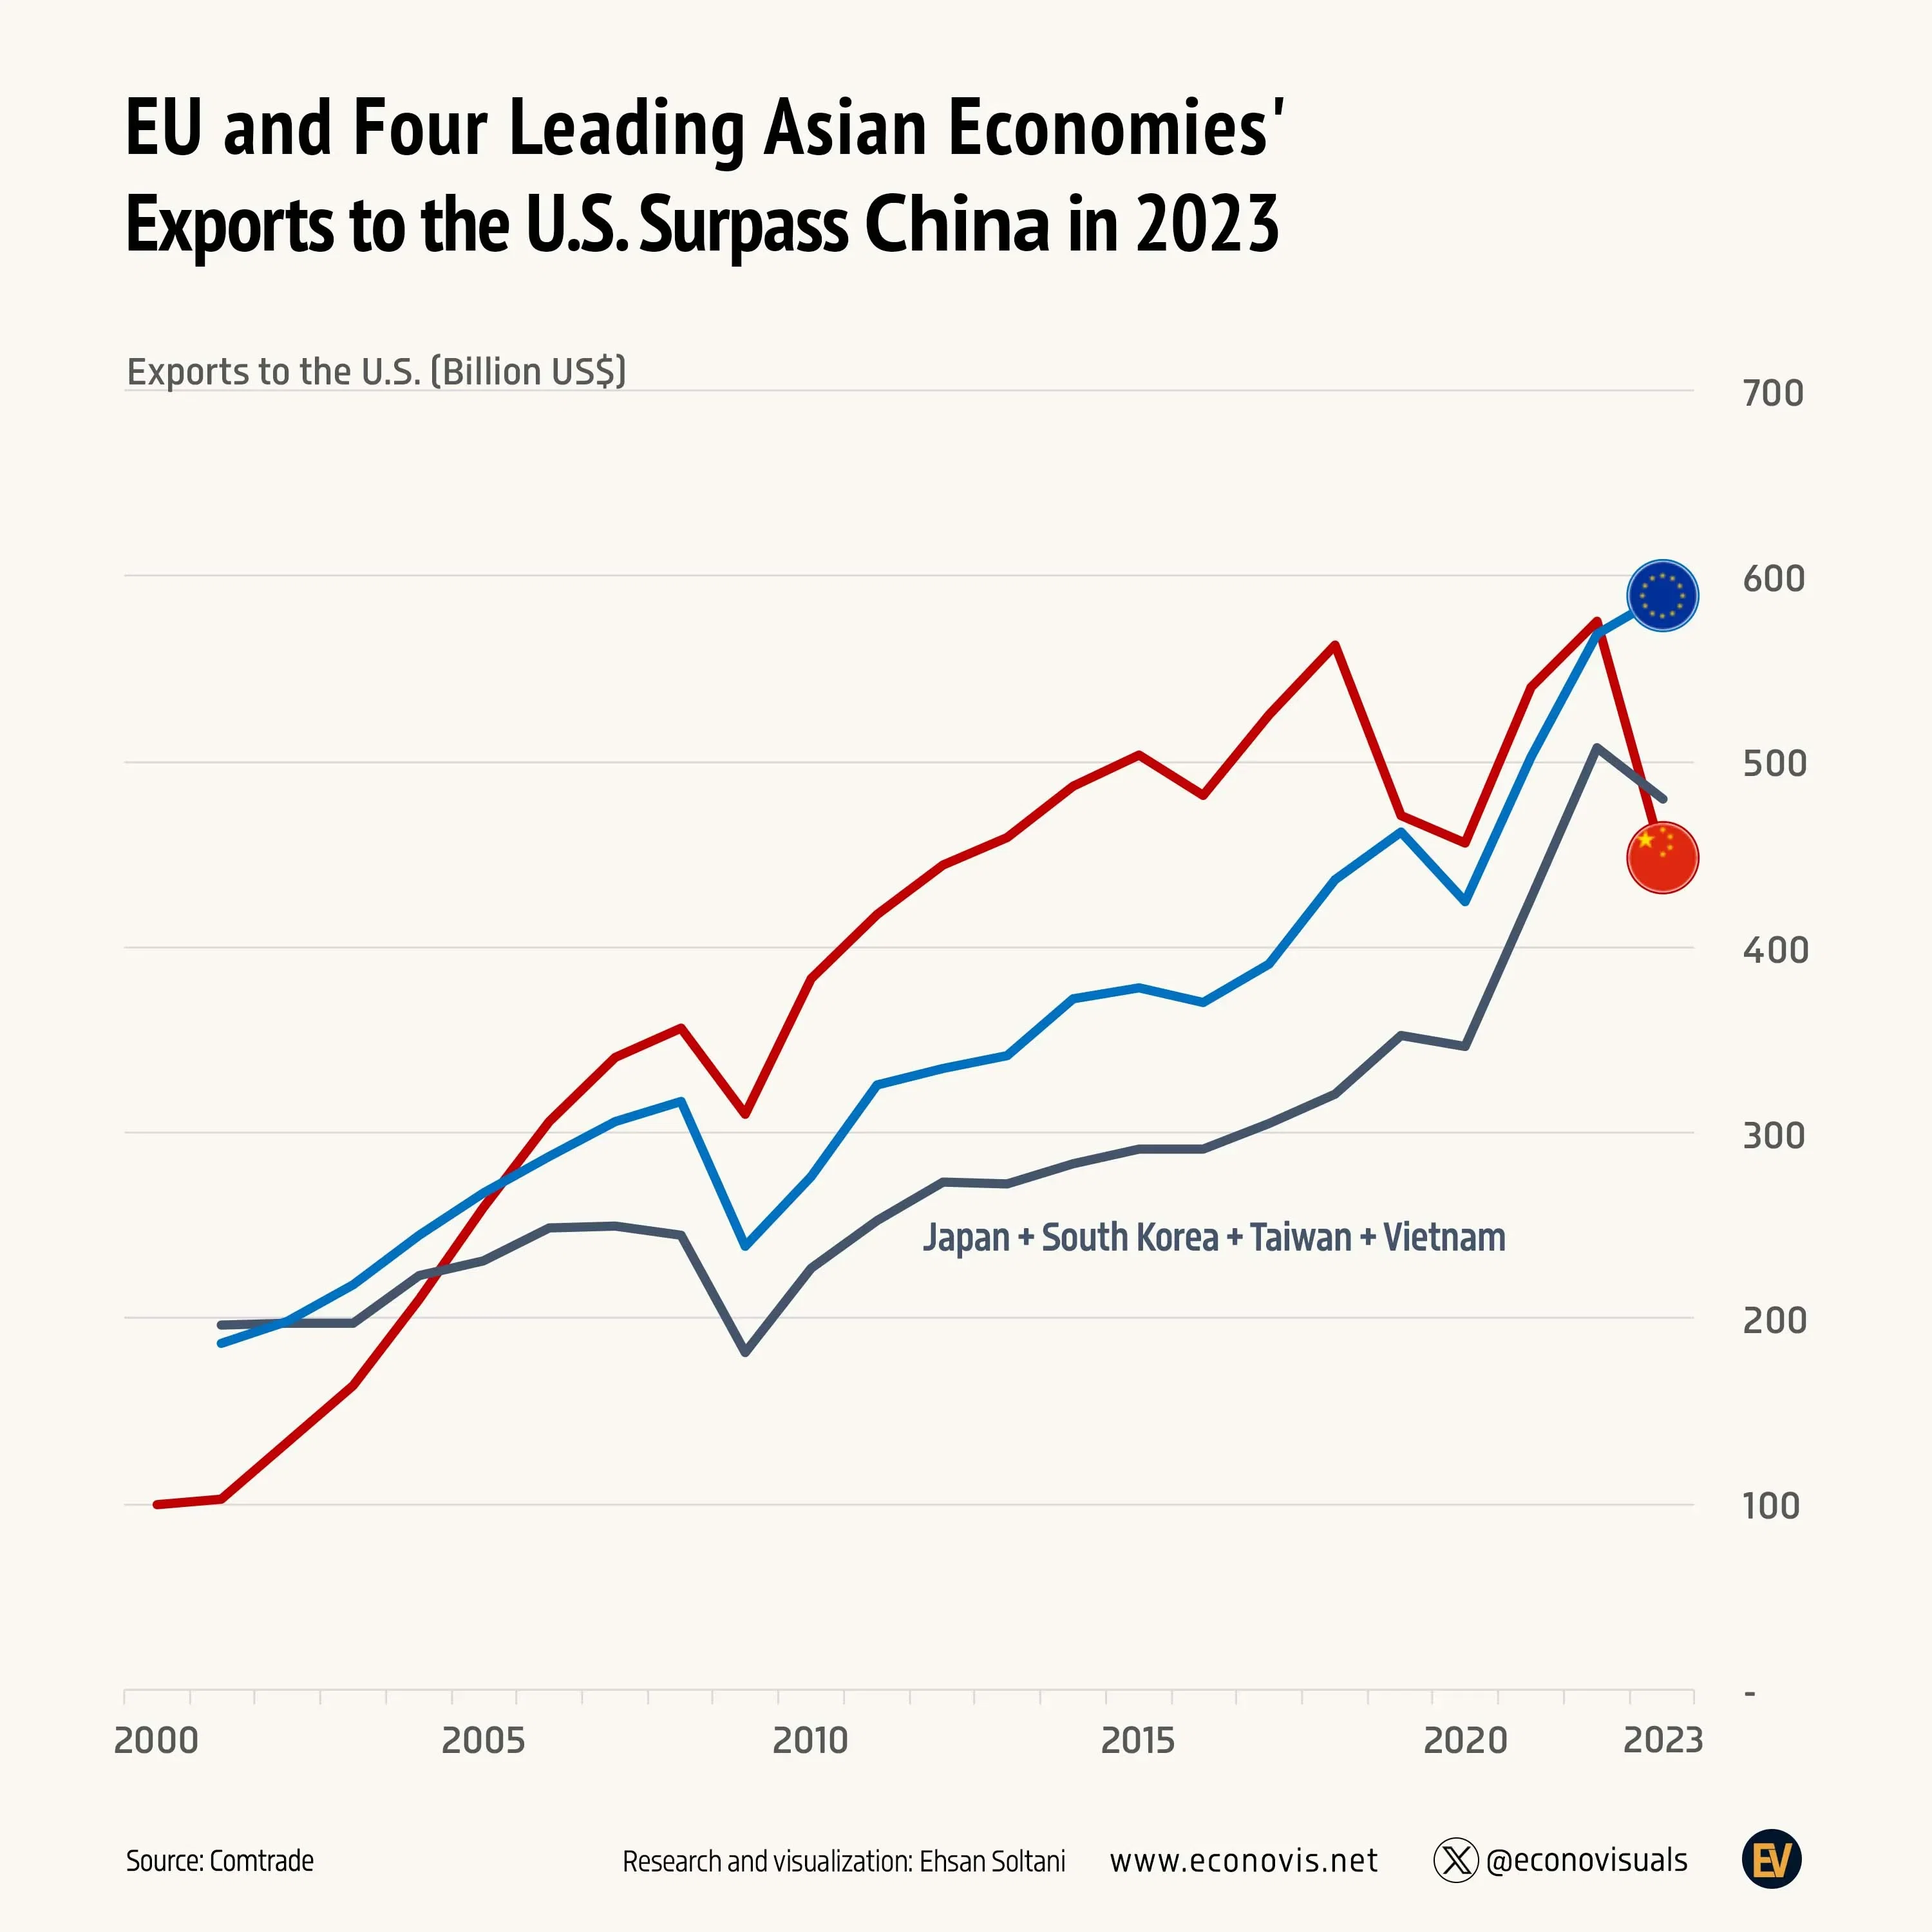
📈 EU and Four Leading Asian Economies' Exports to the U.S. Surpass China in 2023
China's goods exports to the U.S. surpassed the combined exports of the four leading Asian industrial economies (Japan, South Korea, Taiwan, and Vietnam) in 2005 and the European Union in 2006. However, since 2019, China's share has declined, while the EU and these four Asian economies have increased their exports. By 2023, China's exports to the U.S. lagged behind both the EU and the four leading Asian economies.
Dataset
Exports to the U.S. | |||
---|---|---|---|
Billion US$ | |||
China | EU 27 | Japan, South Korea , Taiwan , Vietnam | |
2000 | 100 | ||
2001 | 102 | 186 | 196 |
2002 | 134 | 198 | 198 |
2003 | 163 | 218 | 198 |
2004 | 211 | 244 | 223 |
2005 | 260 | 268 | 231 |
2006 | 306 | 287 | 249 |
2007 | 340 | 306 | 250 |
2008 | 356 | 317 | 245 |
2009 | 310 | 239 | 181 |
2010 | 383 | 277 | 227 |
2011 | 417 | 325 | 252 |
2012 | 444 | 334 | 273 |
2013 | 459 | 342 | 272 |
2014 | 486 | 372 | 283 |
2015 | 504 | 378 | 291 |
2016 | 481 | 370 | 291 |
2017 | 526 | 391 | 305 |
2018 | 563 | 437 | 320 |
2019 | 471 | 462 | 352 |
2020 | 456 | 425 | 346 |
2021 | 540 | 503 | 427 |
2022 | 576 | 569 | 507 |
2023 | 448 | 590 | 480 |
Data sources
18
0
2.4K