Where Data Tells the Story
© Voronoi 2025. All rights reserved.

In 2021, the U.S. imported $2.8 trillion worth of goods.
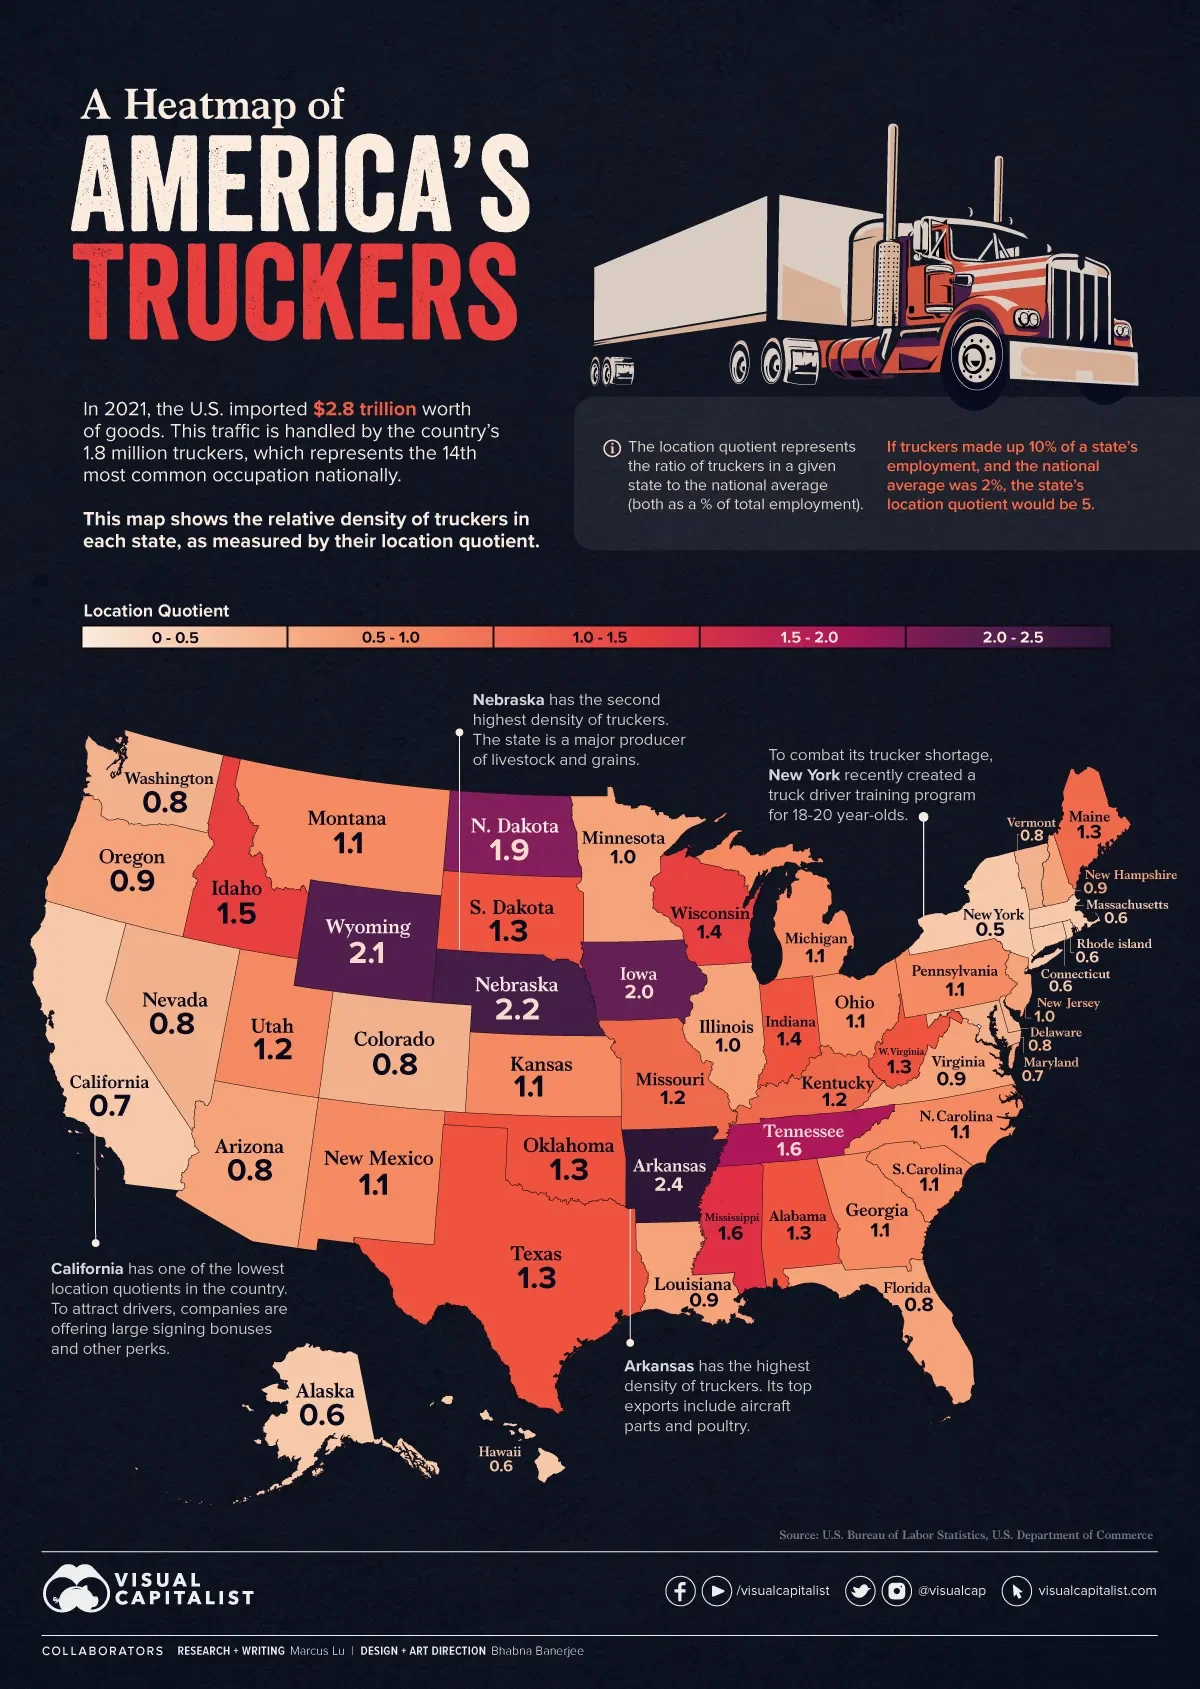
This incredible quantity of goods—along with much of what is produced domestically—is handled by the country’s 1.8 million truckers, which represents the 14th most common occupation nationally. To see how these truckers are distributed across the nation, we’ve visualized data from the U.S. Bureau of Labor Statistics (BLS) to create two separate heat maps.
The relative density of each state’s truckers is measured by their location quotient. This represents the ratio of truckers in a state compared to the national average (both as a % of total employment). For example, if truckers made up 10% of a state’s employment, and the national average was 2%, the location quotient for that state would be 5.
There are four states with a location quotient of two or more: Arkansas, Nebraska, Wyoming, and Iowa. This means that their trucker workforce (as a % of total employment) is at least double the national average.
On the other hand, California and New York have some of the lowest location quotients in the country. Trucking companies have been competing fiercely to attract drivers in these areas, but with limited success. To entice more young people to enter the industry, New York recently created a truck driver training program for 18-20 year olds. Some have voiced their concerns about safety, though few alternatives exist. In October 2021, the American Trucking Association (ATA) announced that the national driver shortage had reached a record-breaking 80,000.
See an expanded version this article at visualcapitalist.com