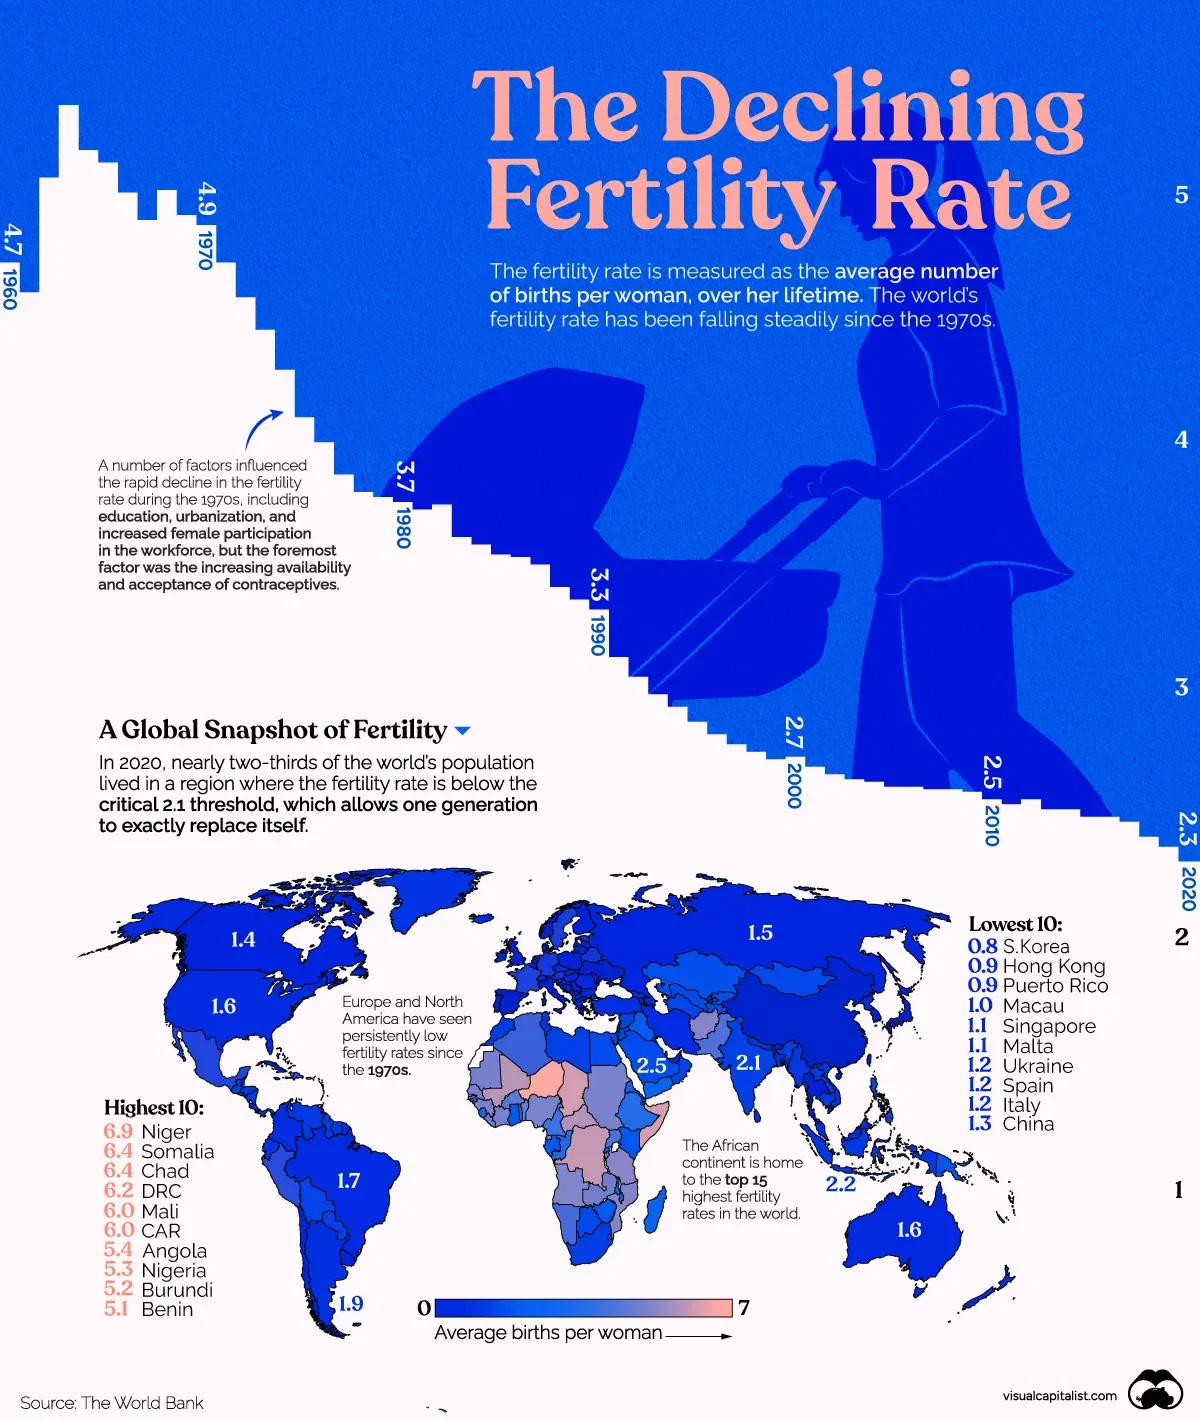
Visualizing the World’s Plummeting Fertility Rate
At the dawn of the 19th century, the world population hit a big milestone: 1 billion people. Over the next 220 years, the number grew to eight times that, or the 8 billion people who live on the planet today, with half of the growth occurring since 1975.
This continuous climb in global population has been possible thanks to advancements in healthcare and nutrition. However, the UN forecasts that rapid growth will slow down—and may even stop entirely by 2100—because of falling fertility rates.
Explained: Fertility and Replacement Rates
The total fertility rate is the average number of births per woman over a lifetime. This measurement makes two key assumptions, however:
- The woman will live to the end of her childbearing years
- The woman will bear children according to the age-specific fertility rates currently observed
Both assumptions add some uncertainty to future fertility rate projections. However, decades of past data collected by the World Bank help show some overall trends around the world, and in many countries.
The world fertility rate (expressed as the number of children per woman) has been falling steadily since the 1970s.
In 2020, the world’s fertility rate stood at 2.3, slightly above the replacement rate of 2.1 births per woman, which allows for one generation to replace itself. This is down more than two times from 4.7 in 1960.
But the world’s average hides the vast disparities between the fertility rate of countries. We dive into the differences below.
Which Country has the Highest Fertility Rate?
According to the UN, nearly two-thirds of the world’s population lives in a region where the fertility rate is below the critical 2.1 threshold.
The African country of Niger currently has the highest fertility rate, at 6.9, which means on average, a woman in Niger will have seven children in her lifetime.
With the exception of Afghanistan (14th), all of the top 30 countries are found on the African continent. In fact, it’s estimated that Africa will add 2.5 billion new people by 2100, while most continents will actually flatline in terms of population growth.
At the bottom of the rankings, the country with the lowest fertility rate is South Korea, at 0.84.
Interestingly, many of the current most populous countries of the world—including China, India, and the U.S.—are all below replacement levels of fertility, with parts of Europe and North America having had persistently low fertility levels since the 1970s.
See the full version of this article on visualcapitalist.com
Dataset
Rank | Country Name | 1960 | 1975 | 1990 | 2005 | 2020 |
---|---|---|---|---|---|---|
1 | Niger | 7.53 | 7.54 | 7.81 | 7.62 | 6.89 |
2 | Somalia | 7.25 | 7.03 | 7.44 | 7.48 | 6.42 |
3 | Chad | 6.25 | 6.88 | 7.22 | 7.13 | 6.35 |
4 | Dem. Rep. of Congo | 6.08 | 6.42 | 6.7 | 6.6 | 6.21 |
5 | Mali | 7 | 7.24 | 7.25 | 6.72 | 6.04 |
6 | Central African Republic | 5.81 | 5.89 | 6.05 | 5.85 | 5.99 |
7 | Angola | 6.71 | 7.49 | 7.27 | 6.46 | 5.37 |
8 | Nigeria | 6.36 | 6.77 | 6.46 | 6.07 | 5.31 |
9 | Burundi | 7 | 7.24 | 7.37 | 6.71 | 5.18 |
10 | Benin | 6.28 | 6.85 | 6.73 | 5.68 | 5.05 |
11 | Burkina Faso | 6.25 | 6.91 | 7.01 | 6.18 | 4.87 |
12 | Tanzania | 6.73 | 7 | 6.2 | 5.61 | 4.8 |
13 | Gambia | 6.25 | 6.41 | 6.22 | 5.72 | 4.78 |
14 | Afghanistan | 7.28 | 7.54 | 7.57 | 6.91 | 4.75 |
15 | Mozambique | 6.32 | 6.69 | 6.22 | 5.61 | 4.71 |
16 | Uganda | 6.94 | 7.23 | 7.04 | 6.57 | 4.69 |
17 | Cameroon | 5.65 | 6.39 | 6.39 | 5.41 | 4.54 |
18 | South Sudan | 6.72 | 6.92 | 7.99 | 6.17 | 4.54 |
19 | Sudan | 6.65 | 6.93 | 6.17 | 5.04 | 4.54 |
20 | Guinea | 6.11 | 6.37 | 6.63 | 5.7 | 4.49 |
21 | Cote d'Ivoire | 7.69 | 7.91 | 6.73 | 5.46 | 4.47 |
22 | Mauritania | 6.35 | 6.68 | 6.06 | 5.19 | 4.46 |
23 | Senegal | 7 | 7.25 | 6.4 | 5.19 | 4.45 |
24 | Zambia | 7.12 | 7.39 | 6.53 | 5.71 | 4.38 |
25 | Equatorial Guinea | 5.65 | 5.79 | 5.99 | 5.56 | 4.35 |
26 | Togo | 6.72 | 7.15 | 6.13 | 5.07 | 4.32 |
27 | Ethiopia | 6.88 | 7.14 | 7.24 | 5.97 | 4.24 |
28 | Rep. of Congo | 6.09 | 6.36 | 5.21 | 4.66 | 4.23 |
29 | Liberia | 6.39 | 6.74 | 6.37 | 5.52 | 4.17 |
30 | Guinea-Bissau | 5.92 | 6.15 | 6.51 | 5.45 | 4.09 |
31 | Sierra Leone | 6.18 | 6.55 | 6.57 | 5.81 | 4.08 |
32 | Comoros | 6.79 | 7.12 | 6.5 | 5.03 | 4.05 |
33 | Solomon Islands | 6.97 | 7.07 | 5.66 | 4.48 | 4.04 |
34 | Samoa | 7.65 | 6.68 | 4.93 | 4.37 | 4 |
35 | Malawi | 7.03 | 7.4 | 6.81 | 5.91 | 4 |
36 | Eritrea | 6.48 | 6.59 | 6.34 | 4.93 | 3.93 |
37 | Madagascar | 7.3 | 7.1 | 6.16 | 5.1 | 3.92 |
38 | Sao Tome & Principe | 6.24 | 6.53 | 5.83 | 4.96 | 3.89 |
39 | Yemen | 7.94 | 8.4 | 8.61 | 5.58 | 3.89 |
40 | Rwanda | 8.19 | 8.22 | 6.87 | 5.44 | 3.87 |
41 | Vanuatu | 6.86 | 6.09 | 5.03 | 4.16 | 3.78 |
42 | Ghana | 6.85 | 6.77 | 5.71 | 4.54 | 3.62 |
43 | West Bank & Gaza | NA | NA | 6.78 | 4.84 | 3.57 |
44 | Pakistan | 6.8 | 6.81 | 6.36 | 4.64 | 3.56 |
45 | Iraq | 5.3 | 6.88 | 5.88 | 4.48 | 3.55 |
46 | Gabon | 4.42 | 5.39 | 5.46 | 4.21 | 3.55 |
47 | Zimbabwe | 7.22 | 6.98 | 4.87 | 3.67 | 3.55 |
48 | Kenya | 7.63 | 7.88 | 6.13 | 4.78 | 3.4 |
49 | Namibia | 6.21 | 6.54 | 5.32 | 3.56 | 3.35 |
50 | Kiribati | 6.55 | 5.03 | 4.64 | 3.8 | 3.33 |
51 | Papua New Guinea | 6.02 | 6.07 | 5.18 | 4.22 | 3.27 |
52 | Tonga | 6.89 | 5.43 | 4.64 | 4.18 | 3.27 |
53 | Timor-Leste | 6.32 | 5.19 | 5.81 | 5.71 | 3.25 |
54 | Tajikistan | 6.55 | 6.6 | 5.34 | 3.44 | 3.24 |
55 | Tuvalu | 4.78 | 3.5 | 3.91 | 3.63 | 3.19 |
56 | Kazakhstan | 4.53 | 3.39 | 2.72 | 2.22 | 3.13 |
57 | Lesotho | 5.82 | 5.9 | 4.76 | 3.44 | 3.05 |
58 | Kyrgyzstan | 5.38 | 4.66 | 3.63 | 2.5 | 3 |
59 | Egypt | 6.79 | 5.8 | 4.48 | 3.15 | 2.96 |
60 | Algeria | 7.5 | 7.37 | 4.56 | 2.56 | 2.94 |
61 | Israel | 3.87 | 3.55 | 2.82 | 2.84 | 2.9 |
62 | Mongolia | 6.83 | 7.13 | 4.23 | 2.03 | 2.9 |
63 | Uzbekistan | 6.61 | 5.89 | 4.07 | 2.36 | 2.9 |
64 | Eswatini | 6.75 | 6.75 | 5.25 | 3.68 | 2.89 |
65 | Jordan | 7.67 | 7.89 | 5.48 | 3.78 | 2.87 |
66 | Haiti | 6.21 | 5.69 | 5.48 | 3.83 | 2.87 |
67 | Djibouti | 6.83 | 6.77 | 5.98 | 3.99 | 2.85 |
68 | Botswana | 6.63 | 6.58 | 4.49 | 3.08 | 2.84 |
69 | Syria | 7.49 | 7.47 | 5.38 | 3.81 | 2.8 |
70 | Philippines | 7.15 | 5.6 | 4.35 | 3.49 | 2.78 |
71 | Micronesia | 6.69 | 6.68 | 4.96 | 3.6 | 2.75 |
72 | Turkmenistan | 6.59 | 5.9 | 4.24 | 2.66 | 2.7 |
73 | Oman | 7.25 | 7.75 | 6.61 | 3.05 | 2.69 |
74 | Bolivia | 6.36 | 5.79 | 4.89 | 3.56 | 2.65 |
75 | Guam | 5.91 | 3.91 | 3.05 | 2.76 | 2.59 |
76 | Lao | 6.29 | 6.29 | 6.08 | 3.67 | 2.54 |
77 | Libya | 7.37 | 7.96 | 4.97 | 2.77 | 2.51 |
78 | Paraguay | 6.5 | 5.21 | 4.55 | 3.04 | 2.5 |
79 | Fiji | 6.46 | 4.1 | 3.41 | 2.89 | 2.5 |
80 | Guatemala | 6.96 | 6.41 | 5.48 | 3.97 | 2.48 |
81 | Saudi Arabia | 7.63 | 7.37 | 5.83 | 3.24 | 2.47 |
82 | Guyana | 6.37 | 4.5 | 3.07 | 2.84 | 2.42 |
83 | South Africa | 6.16 | 5.19 | 3.72 | 2.51 | 2.4 |
84 | Honduras | 7.46 | 6.86 | 5.29 | 3.55 | 2.39 |
85 | Cambodia | 6.25 | 4.1 | 5.64 | 3.24 | 2.38 |
86 | Suriname | 6.61 | 4.73 | 3.27 | 2.75 | 2.37 |
87 | Morocco | 7.04 | 6.27 | 4.02 | 2.57 | 2.35 |
88 | Nicaragua | 7.16 | 6.5 | 4.6 | 2.77 | 2.35 |
89 | Panama | 5.84 | 4.42 | 3.1 | 2.67 | 2.34 |
90 | Dominican Republic | 7.56 | 5.24 | 3.41 | 2.61 | 2.3 |
91 | Faroe Islands | NA | 2.9 | 2.8 | 2.6 | 2.3 |
92 | World | 4.7 | 4.08 | 3.31 | 2.6 | 2.3 |
94 | Venezuela, RB | 6.36 | 4.69 | 3.45 | 2.63 | 2.23 |
95 | Peru | 6.94 | 5.71 | 3.91 | 2.69 | 2.22 |
96 | Indonesia | 5.55 | 5.04 | 3.1 | 2.43 | 2.19 |
97 | Myanmar | 5.98 | 5.29 | 3.54 | 2.55 | 2.17 |
98 | Kuwait | 7.16 | 6.09 | 3.32 | 2.66 | 2.14 |
99 | Tunisia | 6.94 | 6.03 | 3.47 | 1.98 | 2.11 |
100 | Lebanon | 5.82 | 4.56 | 3.3 | 2.2 | 2.1 |
101 | Nepal | 6.03 | 5.75 | 5.21 | 3.14 | 2.06 |
102 | Ecuador | 6.72 | 5.43 | 3.74 | 2.8 | 2.05 |
103 | India | 5.92 | 5.2 | 4.05 | 2.96 | 2.05 |
104 | New Caledonia | 6.28 | 3.7 | 3.18 | 2.2 | 2.04 |
105 | Virgin Islands | 5.45 | 3.63 | 2.99 | 2.24 | 2.03 |
106 | Grenada | 6.74 | 4.02 | 3.49 | 2.34 | 2.02 |
107 | Greenland | NA | 2.35 | 2.44 | 2.38 | 2.02 |
108 | Bangladesh | 6.78 | 6.74 | 4.48 | 2.81 | 2 |
109 | Sri Lanka | 5.47 | 3.79 | 2.52 | 2.28 | 2 |
110 | Belize | 6.5 | 6.28 | 4.7 | 3.13 | 2 |
111 | Georgia | 2.94 | 2.53 | 2.31 | 1.61 | 1.97 |
112 | Vietnam | 6.28 | 5.64 | 3.6 | 1.96 | 1.96 |
113 | Turkiye | 6.38 | 5.07 | 3.13 | 2.22 | 1.92 |
114 | Argentina | 3.08 | 3.3 | 3.03 | 2.43 | 1.91 |
115 | Cabo Verde | 6.89 | 6.77 | 5.39 | 2.93 | 1.91 |
116 | Mexico | 6.76 | 5.79 | 3.45 | 2.5 | 1.91 |
117 | Gibraltar | 3.01 | 2.62 | 2.44 | 1.7 | 1.86 |
118 | Bahrain | 7.15 | 5.62 | 3.76 | 2.62 | 1.83 |
119 | France | 2.85 | 2.09 | 1.77 | 1.94 | 1.83 |
120 | El Salvador | 6.63 | 5.68 | 3.95 | 2.46 | 1.82 |
121 | Malaysia | 6.41 | 4.52 | 3.37 | 2.33 | 1.82 |
122 | North Korea | 3.57 | 3.05 | 2.35 | 1.96 | 1.82 |
123 | Qatar | 6.65 | 6.1 | 4.18 | 2.58 | 1.82 |
124 | St. Vincent & the Grenadines | 7.29 | 4.98 | 2.83 | 2.07 | 1.81 |
125 | Brunei Darussalam | 6.84 | 4.99 | 3.29 | 2.02 | 1.8 |
126 | Moldova | 3.33 | 2.53 | 2.39 | 1.53 | 1.77 |
127 | Montenegro | 3.5 | 2.4 | 1.94 | 1.69 | 1.75 |
128 | Colombia | 6.74 | 4.4 | 3.08 | 2.26 | 1.74 |
129 | Iceland | 4.29 | 2.65 | 2.3 | 2.05 | 1.72 |
130 | Maldives | 6.8 | 7.19 | 6.09 | 2.24 | 1.71 |
131 | Czechia | 2.09 | 2.43 | 1.9 | 1.29 | 1.71 |
132 | Iran | 7.3 | 6.01 | 4.86 | 1.78 | 1.71 |
133 | French Polynesia | 5.89 | 4.71 | 3.44 | 2.19 | 1.71 |
134 | Azerbaijan | 5.88 | 4.18 | 2.74 | 2 | 1.7 |
135 | Denmark | 2.57 | 1.92 | 1.67 | 1.8 | 1.67 |
136 | Sweden | 2.17 | 1.77 | 2.13 | 1.77 | 1.66 |
137 | Brazil | 6.06 | 4.42 | 2.91 | 1.97 | 1.65 |
138 | U.S. | 3.65 | 1.77 | 2.08 | 2.06 | 1.64 |
139 | Trinidad and Tobago | 5.35 | 3.24 | 2.38 | 1.68 | 1.63 |
140 | Ireland | 3.78 | 3.37 | 2.11 | 1.86 | 1.63 |
141 | Barbados | 4.33 | 2.39 | 1.74 | 1.79 | 1.63 |
142 | New Zealand | 4.24 | 2.33 | 2.18 | 1.97 | 1.61 |
144 | Romania | 2.34 | 2.59 | 1.83 | 1.4 | 1.6 |
145 | Slovenia | 2.19 | 2.18 | 1.46 | 1.26 | 1.6 |
146 | Australia | 3.45 | 2.15 | 1.9 | 1.81 | 1.58 |
147 | Estonia | 1.98 | 2.04 | 2.05 | 1.52 | 1.58 |
148 | Armenia | 4.79 | 2.96 | 2.71 | 1.54 | 1.58 |
149 | Slovak Republic | 3.04 | 2.55 | 2.09 | 1.27 | 1.57 |
150 | Antigua and Barbuda | 4.6 | 2.77 | 2.25 | 1.83 | 1.57 |
151 | Isle of Man | 2.88 | 2.05 | 1.92 | 1.85 | 1.57 |
152 | Bulgaria | 2.31 | 2.23 | 1.82 | 1.37 | 1.56 |
153 | United Kingdom | 2.69 | 1.81 | 1.83 | 1.76 | 1.56 |
154 | Hungary | 2.02 | 2.35 | 1.87 | 1.31 | 1.56 |
155 | Costa Rica | 6.71 | 3.8 | 3.21 | 2.04 | 1.56 |
156 | Belgium | 2.54 | 1.74 | 1.62 | 1.76 | 1.55 |
157 | Latvia | 1.94 | 1.96 | 2.02 | 1.39 | 1.55 |
158 | Netherlands | 3.12 | 1.66 | 1.62 | 1.71 | 1.55 |
159 | Chile | 4.7 | 3.18 | 2.58 | 1.8 | 1.54 |
160 | Germany | 2.37 | 1.45 | 1.45 | 1.34 | 1.53 |
161 | Kosovo | 6.36 | 5.25 | 3.65 | 2.61 | 1.53 |
162 | Russia | 2.52 | 1.98 | 1.89 | 1.29 | 1.51 |
163 | Cuba | 4.13 | 2.85 | 1.8 | 1.47 | 1.5 |
164 | Croatia | 2.23 | 1.96 | 1.63 | 1.5 | 1.48 |
165 | Lithuania | 2.56 | 2.18 | 2.03 | 1.29 | 1.48 |
166 | Norway | 2.85 | 1.98 | 1.93 | 1.84 | 1.48 |
167 | Serbia | NA | NA | NA | 1.45 | 1.48 |
168 | Uruguay | 2.83 | 3.02 | 2.43 | 2.1 | 1.48 |
169 | U.A.E | 6.72 | 6.26 | 4.54 | 2.2 | 1.46 |
170 | Switzerland | 2.44 | 1.61 | 1.58 | 1.42 | 1.46 |
171 | Austria | 2.69 | 1.83 | 1.46 | 1.41 | 1.44 |
172 | Mauritius | 6.17 | 3.2 | 2.32 | 1.88 | 1.44 |
173 | Bhutan | 6.7 | 6.62 | 5.6 | 2.8 | 1.43 |
174 | St. Lucia | 6.97 | 5.46 | 3.4 | 1.68 | 1.41 |
175 | Albania | 6.46 | 4.52 | 2.9 | 1.8 | 1.4 |
176 | Canada | 3.81 | 1.82 | 1.83 | 1.57 | 1.4 |
177 | Portugal | 3.16 | 2.75 | 1.56 | 1.41 | 1.4 |
178 | Bahamas | 4.82 | 3.26 | 2.53 | 2.05 | 1.39 |
179 | Belarus | 2.67 | 2.17 | 1.91 | 1.25 | 1.38 |
180 | Poland | 2.98 | 2.27 | 2.06 | 1.24 | 1.38 |
181 | Finland | 2.72 | 1.68 | 1.78 | 1.8 | 1.37 |
182 | Luxembourg | 2.29 | 1.55 | 1.6 | 1.63 | 1.37 |
183 | Bosnia & Herzegovina | 3.91 | 2.36 | 1.79 | 1.2 | 1.36 |
184 | Jamaica | 5.58 | 4.5 | 2.85 | 2.06 | 1.36 |
185 | Thailand | 6.25 | 4.4 | 2.09 | 1.59 | 1.34 |
186 | Greece | 2.23 | 2.33 | 1.39 | 1.34 | 1.34 |
187 | Japan | 2 | 1.91 | 1.54 | 1.26 | 1.34 |
188 | Cyprus | 3.51 | 2.11 | 2.41 | 1.48 | 1.33 |
189 | Aruba | 4.82 | 2.51 | 2.3 | 1.78 | 1.33 |
191 | North Macedonia | 3.97 | 2.59 | 2.19 | 1.5 | 1.3 |
192 | China | 4.45 | 3.57 | 2.51 | 1.62 | 1.28 |
193 | Italy | 2.4 | 2.17 | 1.33 | 1.34 | 1.24 |
194 | Spain | 2.86 | 2.77 | 1.36 | 1.33 | 1.23 |
195 | Ukraine | 2.24 | 2.02 | 1.85 | 1.21 | 1.22 |
196 | Malta | 3.62 | 2.27 | 2.02 | 1.38 | 1.13 |
197 | Singapore | 5.76 | 2.07 | 1.83 | 1.26 | 1.1 |
198 | Macao SAR, China | 4.93 | 1.6 | 1.74 | 0.83 | 1.07 |
199 | British Virgin Islands | 5.16 | 3.36 | 1.59 | 1.34 | 0.98 |
200 | Puerto Rico | 4.8 | 2.77 | 2.38 | 1.77 | 0.9 |
201 | Hong Kong | 5.07 | 2.67 | 1.27 | 0.96 | 0.87 |
202 | South Korea | 5.95 | 3.43 | 1.57 | 1.09 | 0.84 |
Data sources
Data note: The World Bank uses a number of sources to aggregate their data including the UN population division, Eurostat, and several national statistics programs. Data for some years is missing and has been marked as “NA.” Please visit their website for more information. Definition: The age-specific fertility rate (ASFR) “measures the annual number of births to women of a specified age or age group per 1,000 women in that age group,” according to the UN.