DemographicsJan 20, 2024
The Median Age of U.S. States: Utah is the Youngest; Maine the Oldest
What We’re Showing
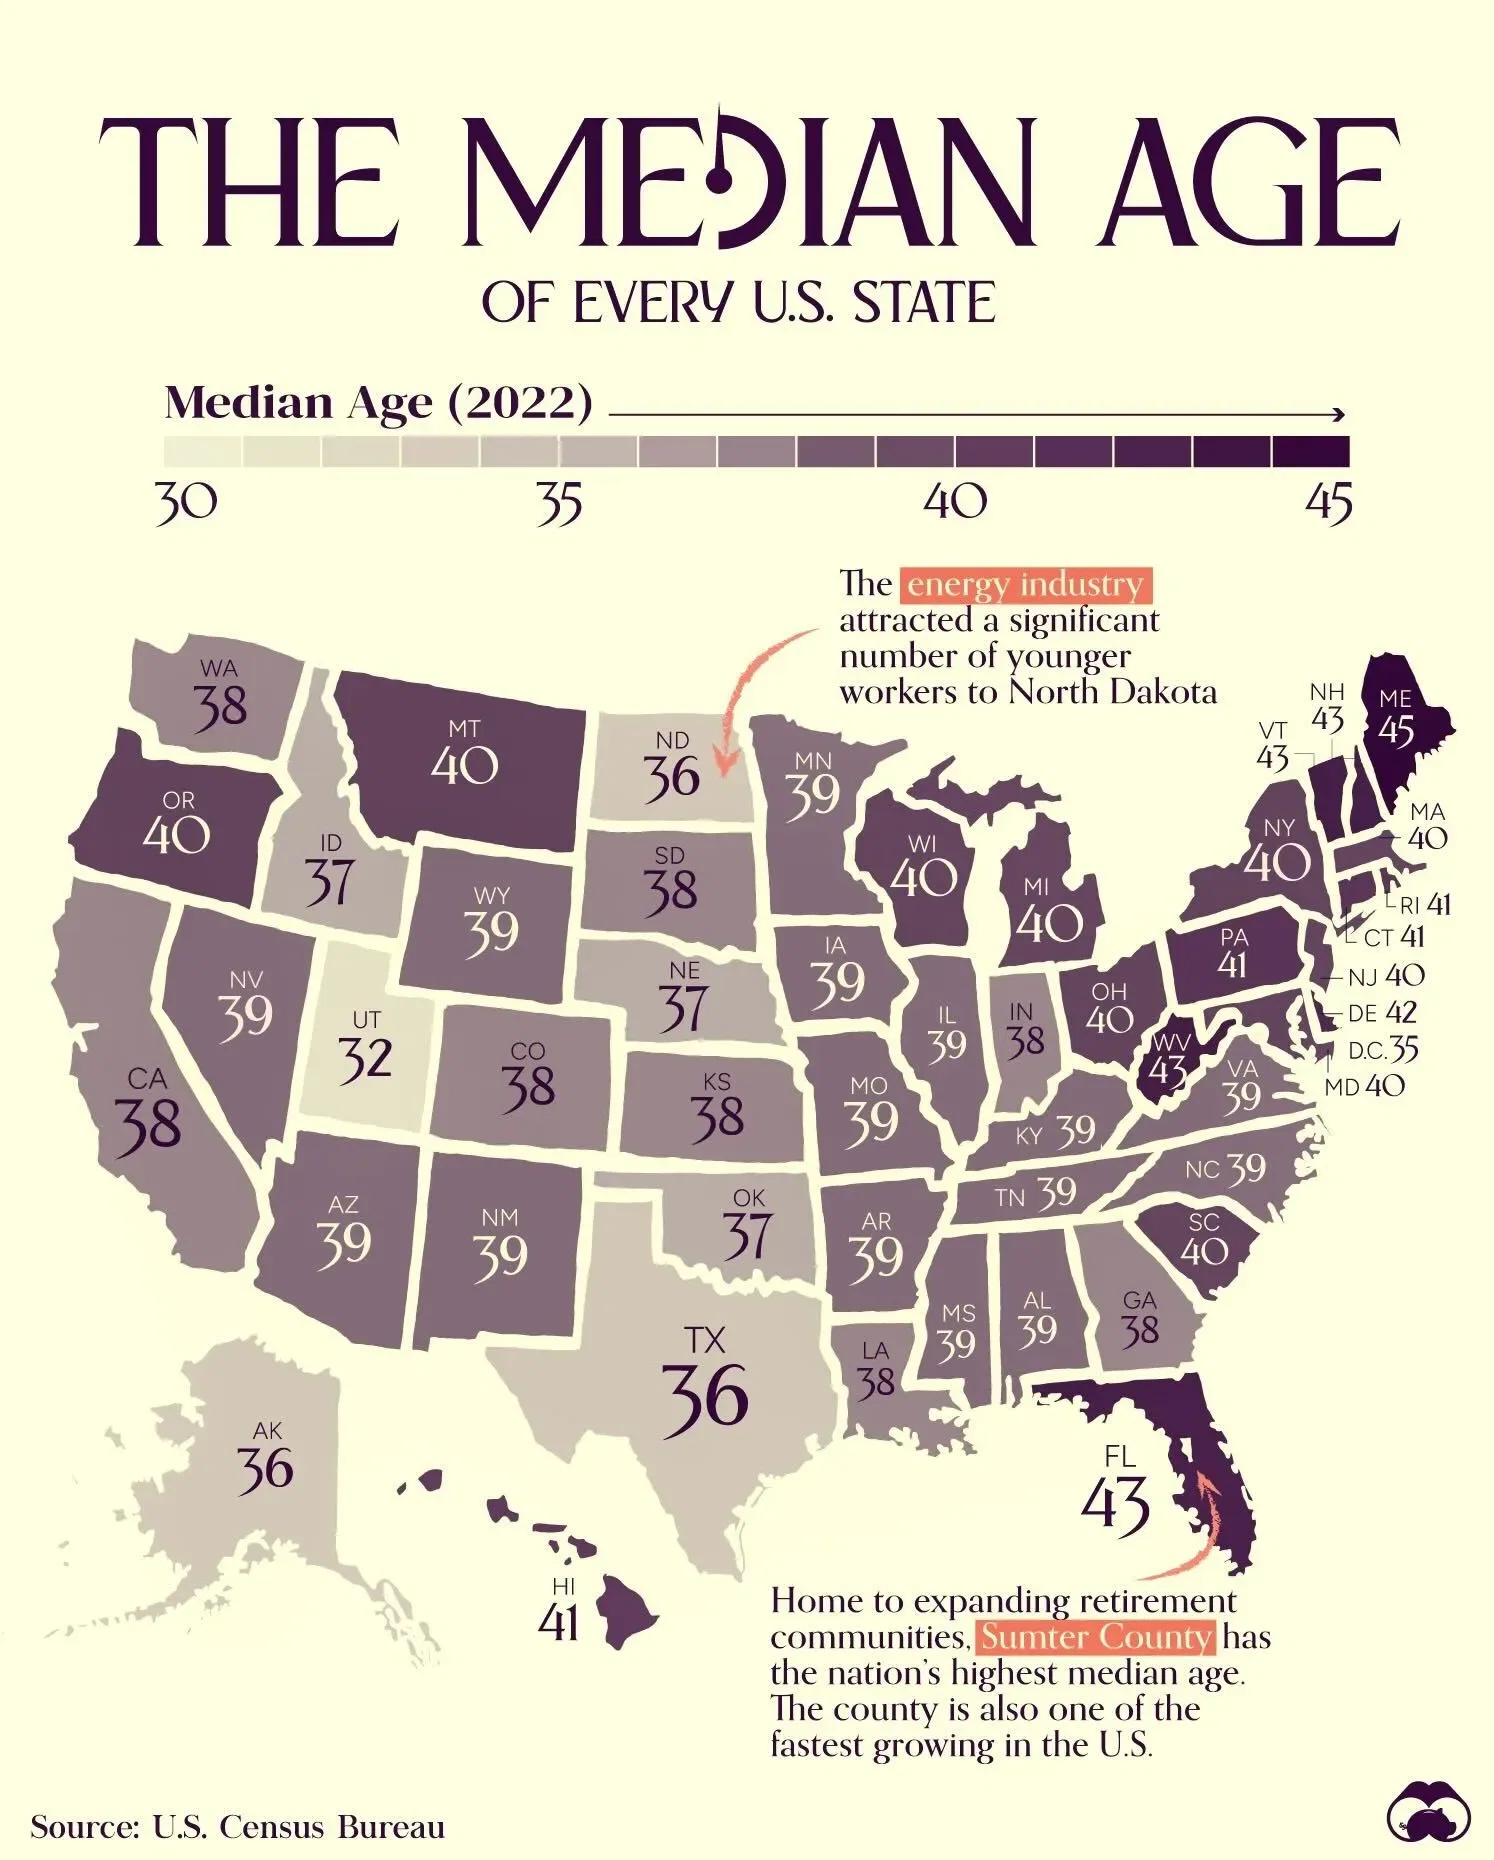
The median age of each U.S. state using the latest data from the U.S. Census Bureau.
The Big Picture
The median age for the United States as a whole is 39 years, which is slightly lower than the median for all high-income countries (41). The median age for the nation is slowly rising and is expected to pass 40 in coming years.
Zooming in, most states have a lot of variance at the county level, with cities, colleges, and natural resource sites generally lowering the median age in a county. Explore median age differences within states using the Census Bureau’s interactive tool.
Regional Differences
- The Northeast states have the highest median ages, along with West Virginia and Florida.
- Utah and Washington DC have the lowest median age.
- For context, Utah, the youngest state, has a median age similar to the global average (30). Maine’s median age is on the high end, in line with Italy and Greece.
Dataset
Rank | State | Median Age (2022) | |
---|---|---|---|
1 | Maine | 44.8 | 45 |
2 | New Hampshire | 43.3 | 43 |
3 | Vermont | 43.2 | 43 |
4 | West Virginia | 42.8 | 43 |
5 | Florida | 42.7 | 43 |
6 | Delaware | 41.8 | 42 |
7 | Connecticut | 40.9 | 41 |
7 | Pennsylvania | 40.9 | 41 |
9 | Hawaii | 40.7 | 41 |
10 | Rhode Island | 40.6 | 41 |
11 | Wisconsin | 40.4 | 40 |
12 | New Jersey | 40.3 | 40 |
12 | Oregon | 40.3 | 40 |
12 | South Carolina | 40.3 | 40 |
15 | Michigan | 40.2 | 40 |
15 | Montana | 40.2 | 40 |
17 | Massachusetts | 40.1 | 40 |
18 | New York | 39.9 | 40 |
19 | Ohio | 39.7 | 40 |
20 | Maryland | 39.6 | 40 |
21 | Alabama | 39.4 | 39 |
21 | Kentucky | 39.4 | 39 |
23 | Illinois | 39.2 | 39 |
23 | Missouri | 39.2 | 39 |
23 | North Carolina | 39.2 | 39 |
23 | Wyoming | 39.2 | 39 |
27 | Tennessee | 39.1 | 39 |
28 | New Mexico | 39 | 39 |
28 | Virginia | 39 | 39 |
30 | Minnesota | 38.9 | 39 |
30 | Nevada | 38.9 | 39 |
32 | Iowa | 38.8 | 39 |
33 | Arizona | 38.7 | 39 |
34 | Arkansas | 38.6 | 39 |
35 | Mississippi | 38.5 | 39 |
36 | Washington | 38.3 | 38 |
37 | Indiana | 38.2 | 38 |
38 | Louisiana | 38.1 | 38 |
39 | South Dakota | 37.9 | 38 |
40 | California | 37.8 | 38 |
41 | Colorado | 37.6 | 38 |
42 | Georgia | 37.5 | 38 |
42 | Kansas | 37.5 | 38 |
44 | Idaho | 37.3 | 37 |
44 | Nebraska | 37.3 | 37 |
46 | Oklahoma | 37.1 | 37 |
47 | Alaska | 35.8 | 36 |
47 | North Dakota | 35.8 | 36 |
49 | Texas | 35.5 | 36 |
50 | District of Columbia | 34.8 | 35 |
51 | Utah | 31.9 | 32 |
Data sources
Numbers in the graphic have been rounded for simplicity. See the data tab for more granular figures.
48
0
35.2K