Where Data Tells the Story
© Voronoi 2026. All rights reserved.
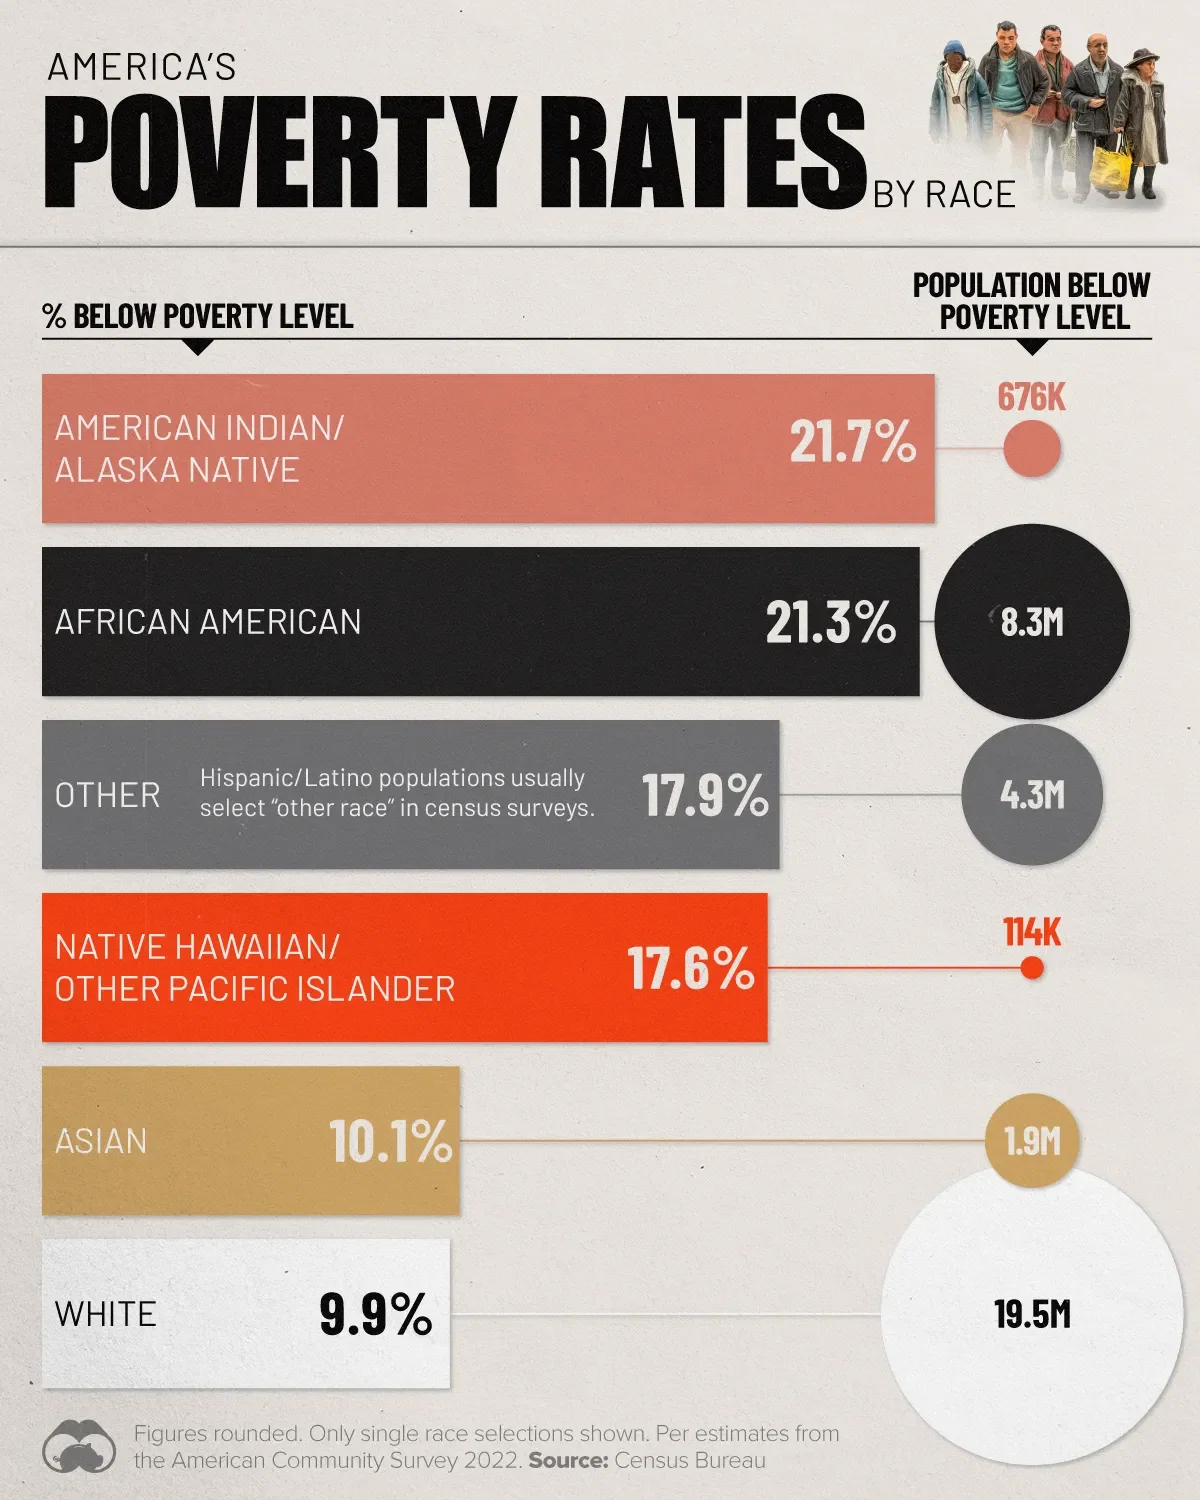
This chart lists the rate and number of Americans below the poverty level, categorized by self-selected race.
Data was sourced from the American Community Survey 2022, conducted by the Census Bureau. For this chart only single race selections have been visualized.
The Census Bureau uses a set of income thresholds that vary by family size and composition to determine the poverty line.
If a family's total income is less than the calculated threshold, then that family and every individual in it is considered in poverty.