DemographicsMay 14, 2024
Mexico, India & China Are the Top Sources of U.S. Immigrants 🧳
What we’re showing
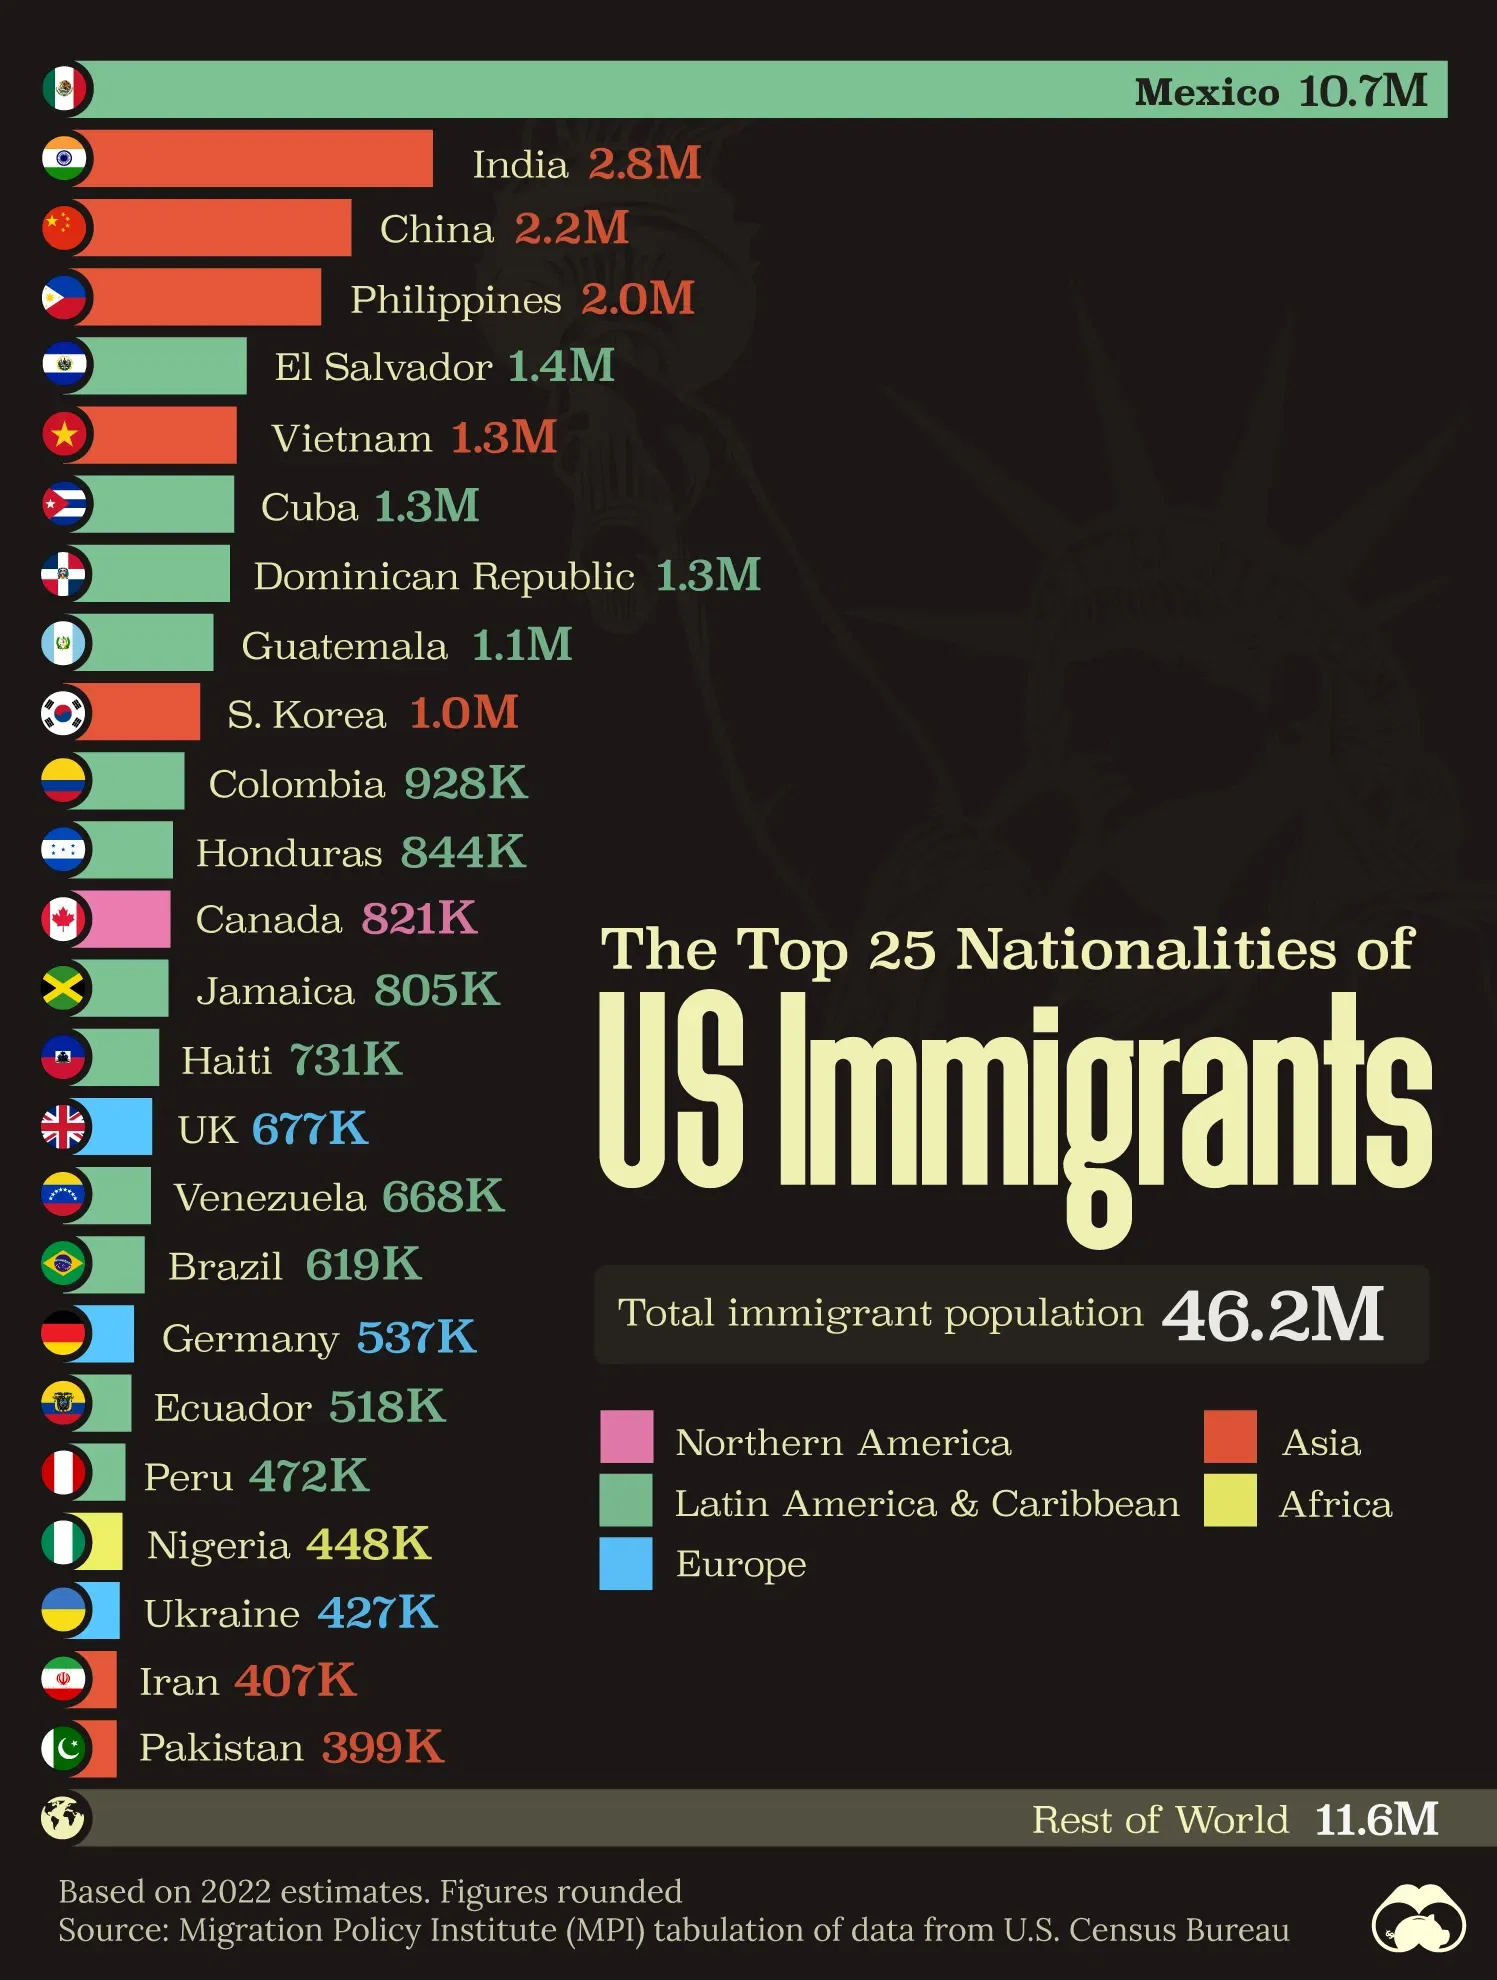
This graphic shows the top 25 country sources of U.S. immigrants, based on 2022 estimates. “Immigrants” in this context refers to people residing in the United States who were not U.S. citizens at birth.
These figures come from the Migration Policy Institute (MPI), which analyzed data from the U.S. Census Bureau’s 2022 American Community Survey.
Mexico a leading source of immigration
Mexico is the largest source of immigrants due to its proximity and historical ties.
Economic factors, including wage disparity and employment opportunities, drive many Mexicans to seek better prospects north of the border.
It's worth noting that the U.S. is also home to over 5 million unauthorized immigrants from Mexico, based on an MPI analysis of 2019 population estimates.
Dataset
Country | Region | # of Immigrants |
---|---|---|
Mexico | North America | 10,678,502 |
India | Asia | 2,839,618 |
China | Asia | 2,217,894 |
Philippines | Asia | 1,982,333 |
El Salvador | North America | 1,407,622 |
Vietnam | Asia | 1,331,192 |
Cuba | North America | 1,312,510 |
Dominican Republic | North America | 1,279,900 |
Guatemala | North America | 1,148,543 |
Korea | Asia | 1,045,100 |
Colombia | South America | 928,053 |
Honduras | North America | 843,774 |
Canada | North America | 821,322 |
Jamaica | North America | 804,775 |
Haiti | North America | 730,780 |
United Kingdom | Europe | 676,652 |
Venezuela | South America | 667,664 |
Brazil | South America | 618,525 |
Germany | Europe | 537,484 |
Ecuador | South America | 518,287 |
Peru | South America | 471,988 |
Nigeria | Africa | 448,405 |
Ukraine | Europe | 427,163 |
Iran | Middle East | 407,283 |
Pakistan | Asia | 399,086 |
Rest of World | 11,637,634 | |
Total | 46,182,089 |
129
0
30.4K