Where Data Tells the Story
© Voronoi 2026. All rights reserved.

From the icy expanses of the Arctic to the warm Caribbean sea, the North American continent covers nearly 25 million square kilometers, or about 15% of the Earth’s land area. Populating this vast region are nearly half a billion people, spread out from coast to valley, along the edges of arid scrublands and rainforests.
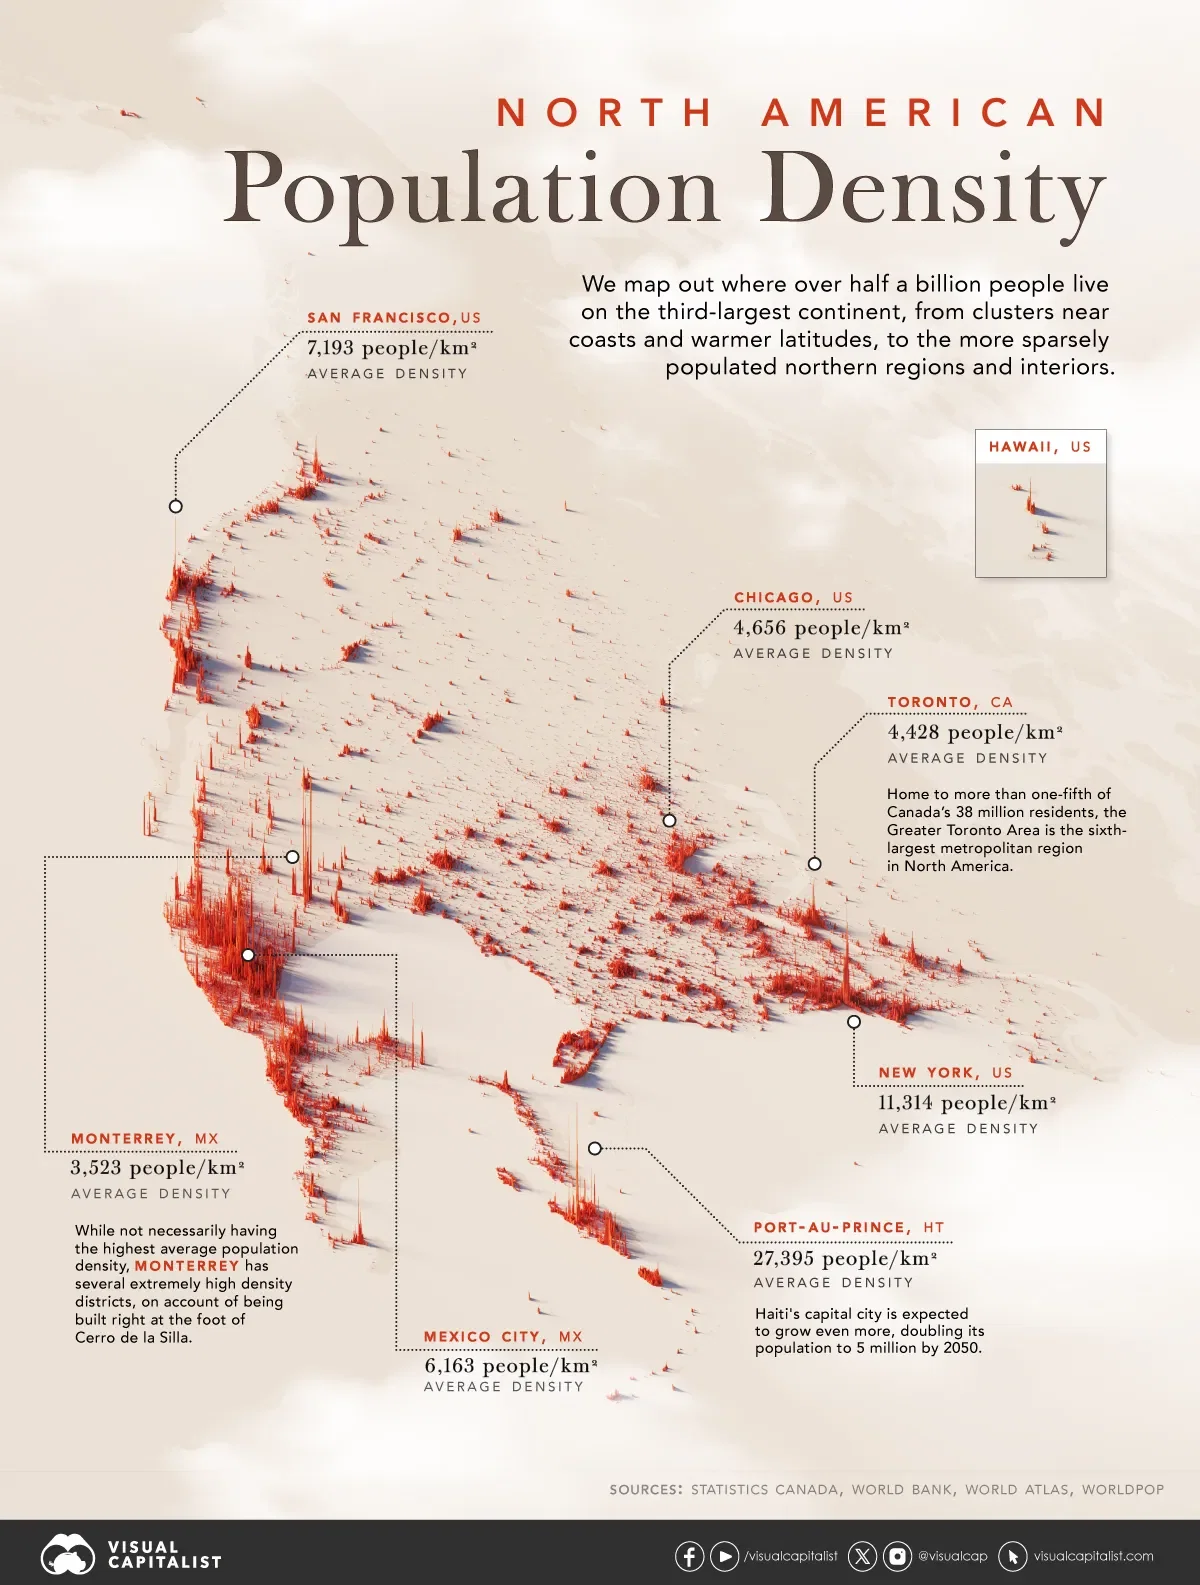
We visualize a map of North America population patterns, including Central America and the Caribbean, with spikes illustrating densely populated areas.
Data for this map is sourced from Statistics Canada, the World Bank, and WorldPop—a research group based out of the University of Southampton that tracks population growth and movement across the globe.
Deep in the Atlantic, seen as a small dot near Haiti on the map, the island state of Bermuda is the most densely populated jurisdiction on the continent. Measuring just 53 km² in area, and home to 65,000 people, results in an average population density of 1,266 people per km².
Also in the Caribbean, Barbados ranks second with an average population density 647 people/km², followed by Puerto Rico, ranked third-highest at 430 people/km², despite its much larger area—9,104 km².
Naturally the largest countries on the continent—Canada, the U.S., and Mexico—have some of the lowest average population densities compared to other nations in the region.
However, thanks to their size, their overall population distribution is more apparent on a map of this scale. In Canada, the Greater Toronto Area is home to one-fifth the country’s entire population. In stark contrast, the rest of the country seems almost empty—averaging just 3 people/km².
Major U.S. cities—New York, Chicago, and San Francisco—also stand out, though the more regular dispersion of Americans, particularly in the Northeast, South, and Midwest can also be seen.
Interestingly, Monterrey in Mexico jumps out on the map; the city is built at the foot of Cerro de la Silla, and several districts are densely populated as a result.
How does North America compare to the other continents by population density?
Unsurprisingly, thanks to its large land area, as well as comparatively smaller population, North America is one of the least densely populated continents in the world, beaten only by Oceania, which averages 5 people/km², and Antarctica.