
Where Data Tells the Story
© Voronoi 2026. All rights reserved.

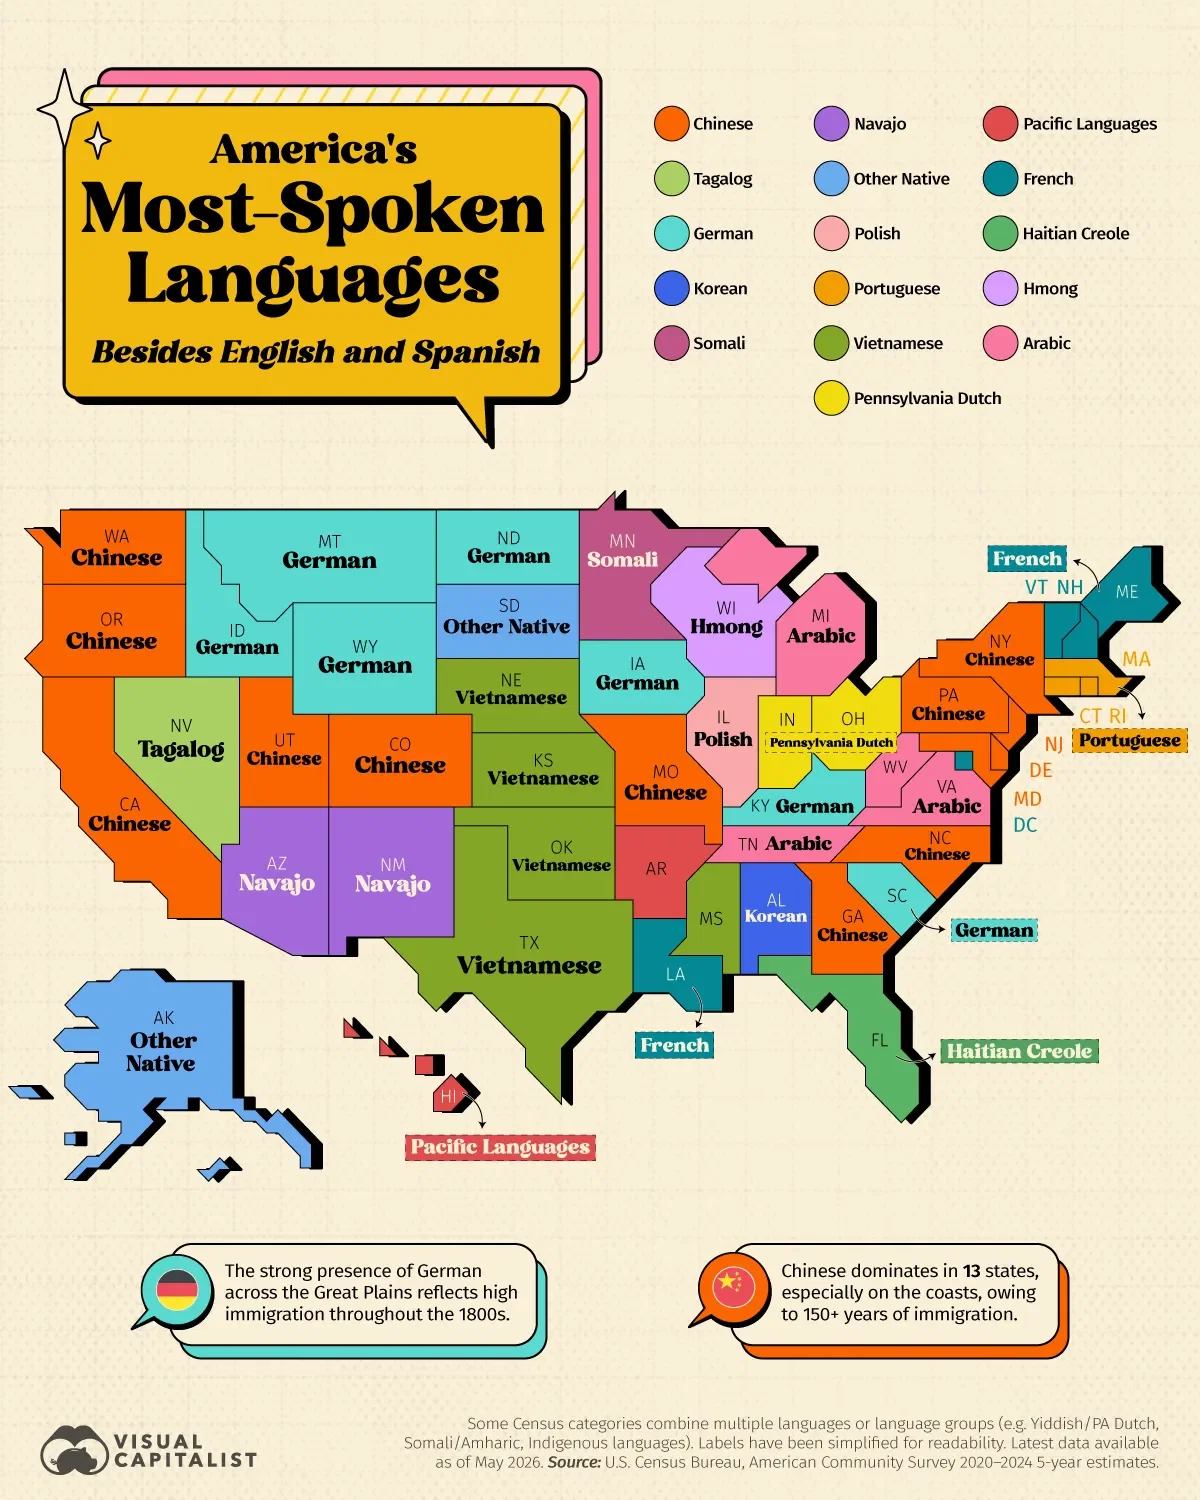
America’s linguistic map looks very different once English and Spanish are removed.
This map shows the most-spoken language in every U.S. state after English and Spanish, based on U.S. Census Bureau American Community Survey data from 2020–2024.
From Chinese in New York and California to Navajo in the Southwest, the results reveal how immigration, Indigenous communities, and regional history continue to shape the country.
Read the full article here.