Where Data Tells the Story
© Voronoi 2026. All rights reserved.
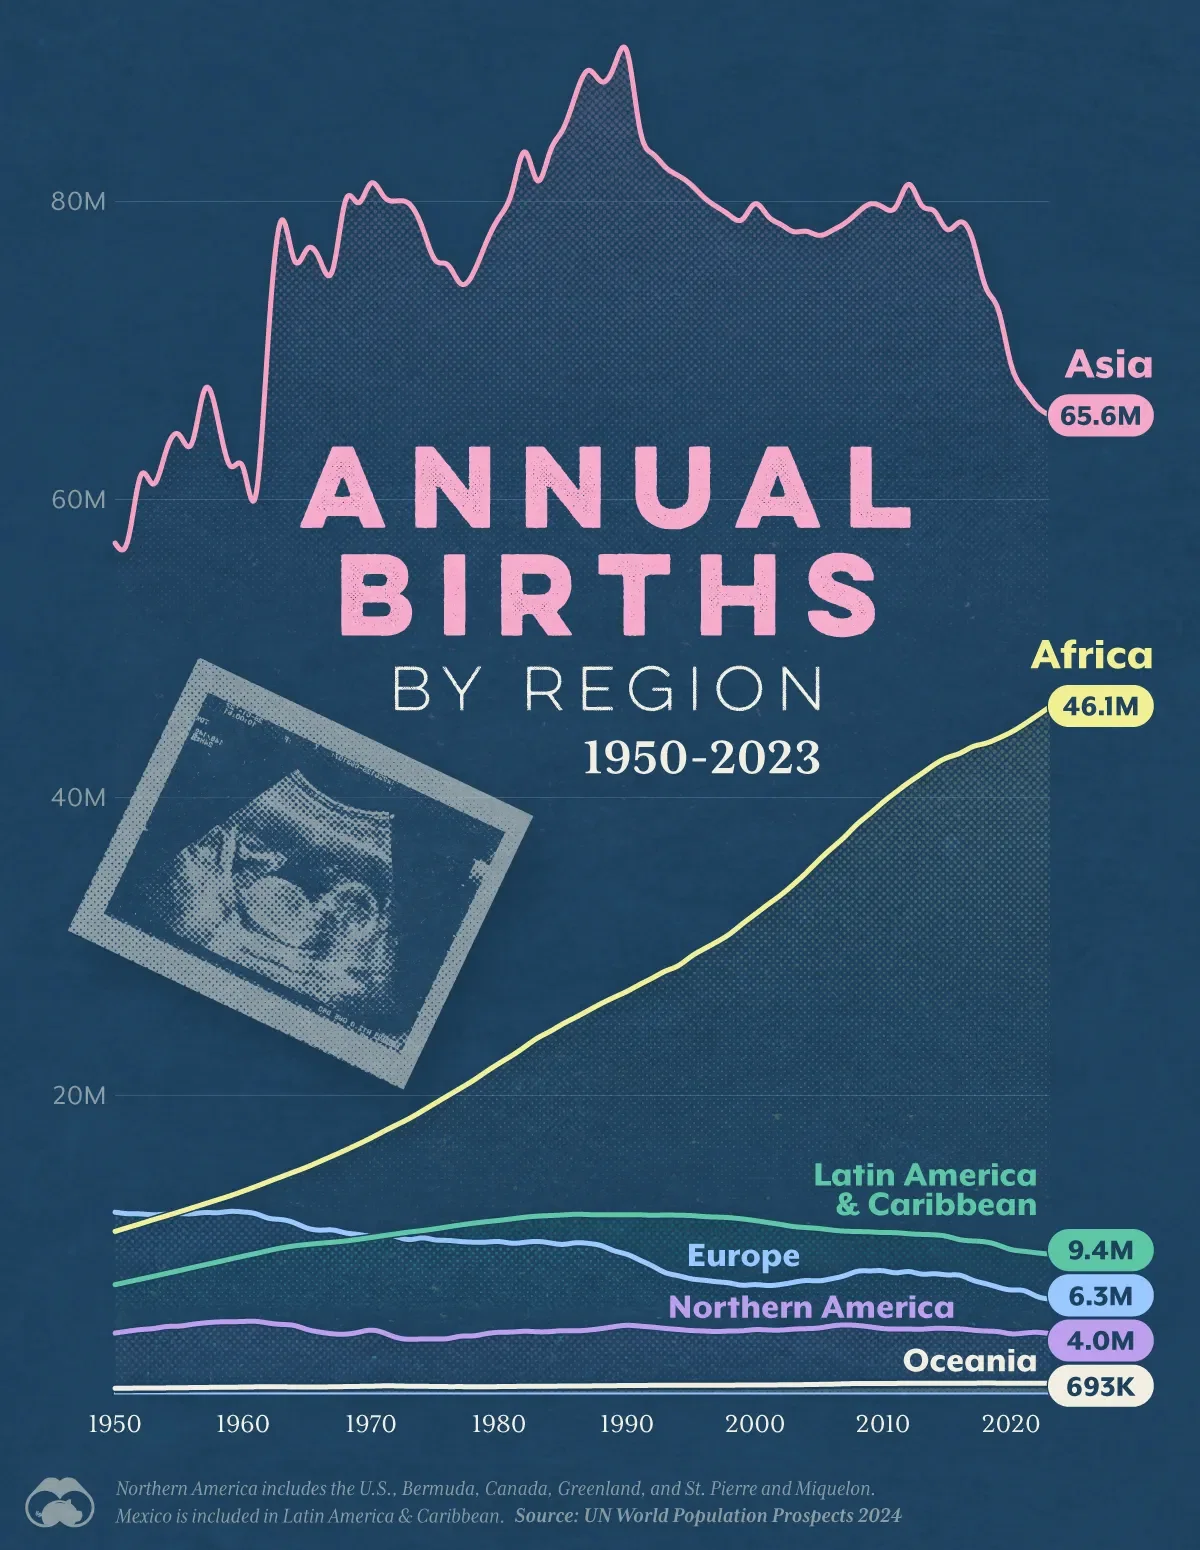
This graphic visualizes the number of births in each global region, from 1950 to 2023. All figures were sourced from the UN World Population Prospects 2024.
Note that "Northern America" includes the U.S., Bermuda, Canada, Greenland, and St. Pierre and Miquelon. Mexico is included in Latin America & Caribbean.