Where Data Tells the Story
© Voronoi 2026. All rights reserved.

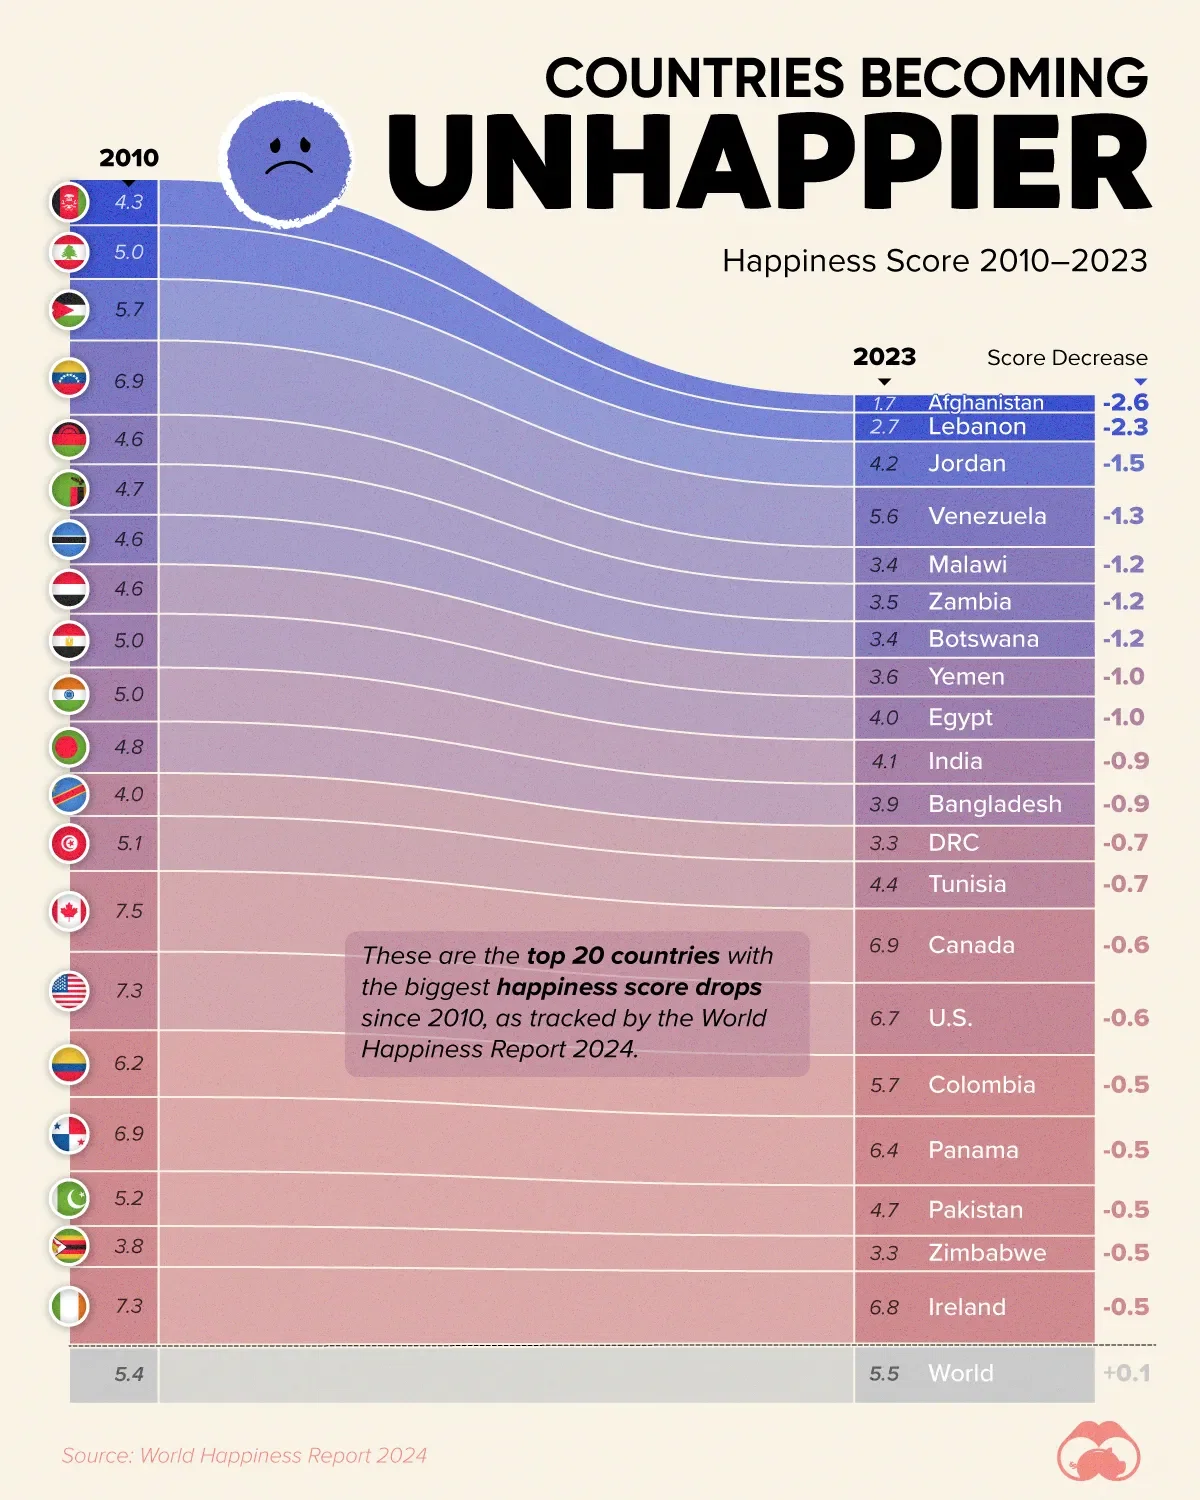
A bar chart with the top 10 countries whose happiness has fallen since 2010, ranked by their score increases. All values are out of 10.
Afghanistan is now not only the unhappiest country in the world right now, it’s also 60% unhappier than over a decade ago, indicating how much life has worsened since 2010.
In 2021, the Taliban officially returned to power in Afghanistan, after nearly two decades of American occupation in the country. The Islamic fundamentalist group has made life harder, especially for women, who are now restricted from pursuing higher education, travel, and work.
On a broader scale, the Afghan economy has suffered post Taliban takeover, with various consequent effects: mass unemployment, a drop in income, malnutrition, and a crumbling healthcare system.
Sanctions against senior Taliban leaders have also prevented the country from engaging with international finance systems.
The country also saw two devastating earthquakes in 2022 and 2023, and its agriculture sector has all but collapsed after persistent, years-long, droughts.
Nine countries in total saw a drop in their happiness score by a full point or more, on the 0–10 scale.
The World Happiness Report sources their data from the Gallup World Poll, which asks 1,000 respondents in nearly every country to evaluate their life on a 0–10 scale, with 10 representing the best life they could lead, and 0 the worst. Results are then averaged over three-years, and the final number taken as a “happiness” score. The above chart represents a score loss (out of 10) over the last decade.