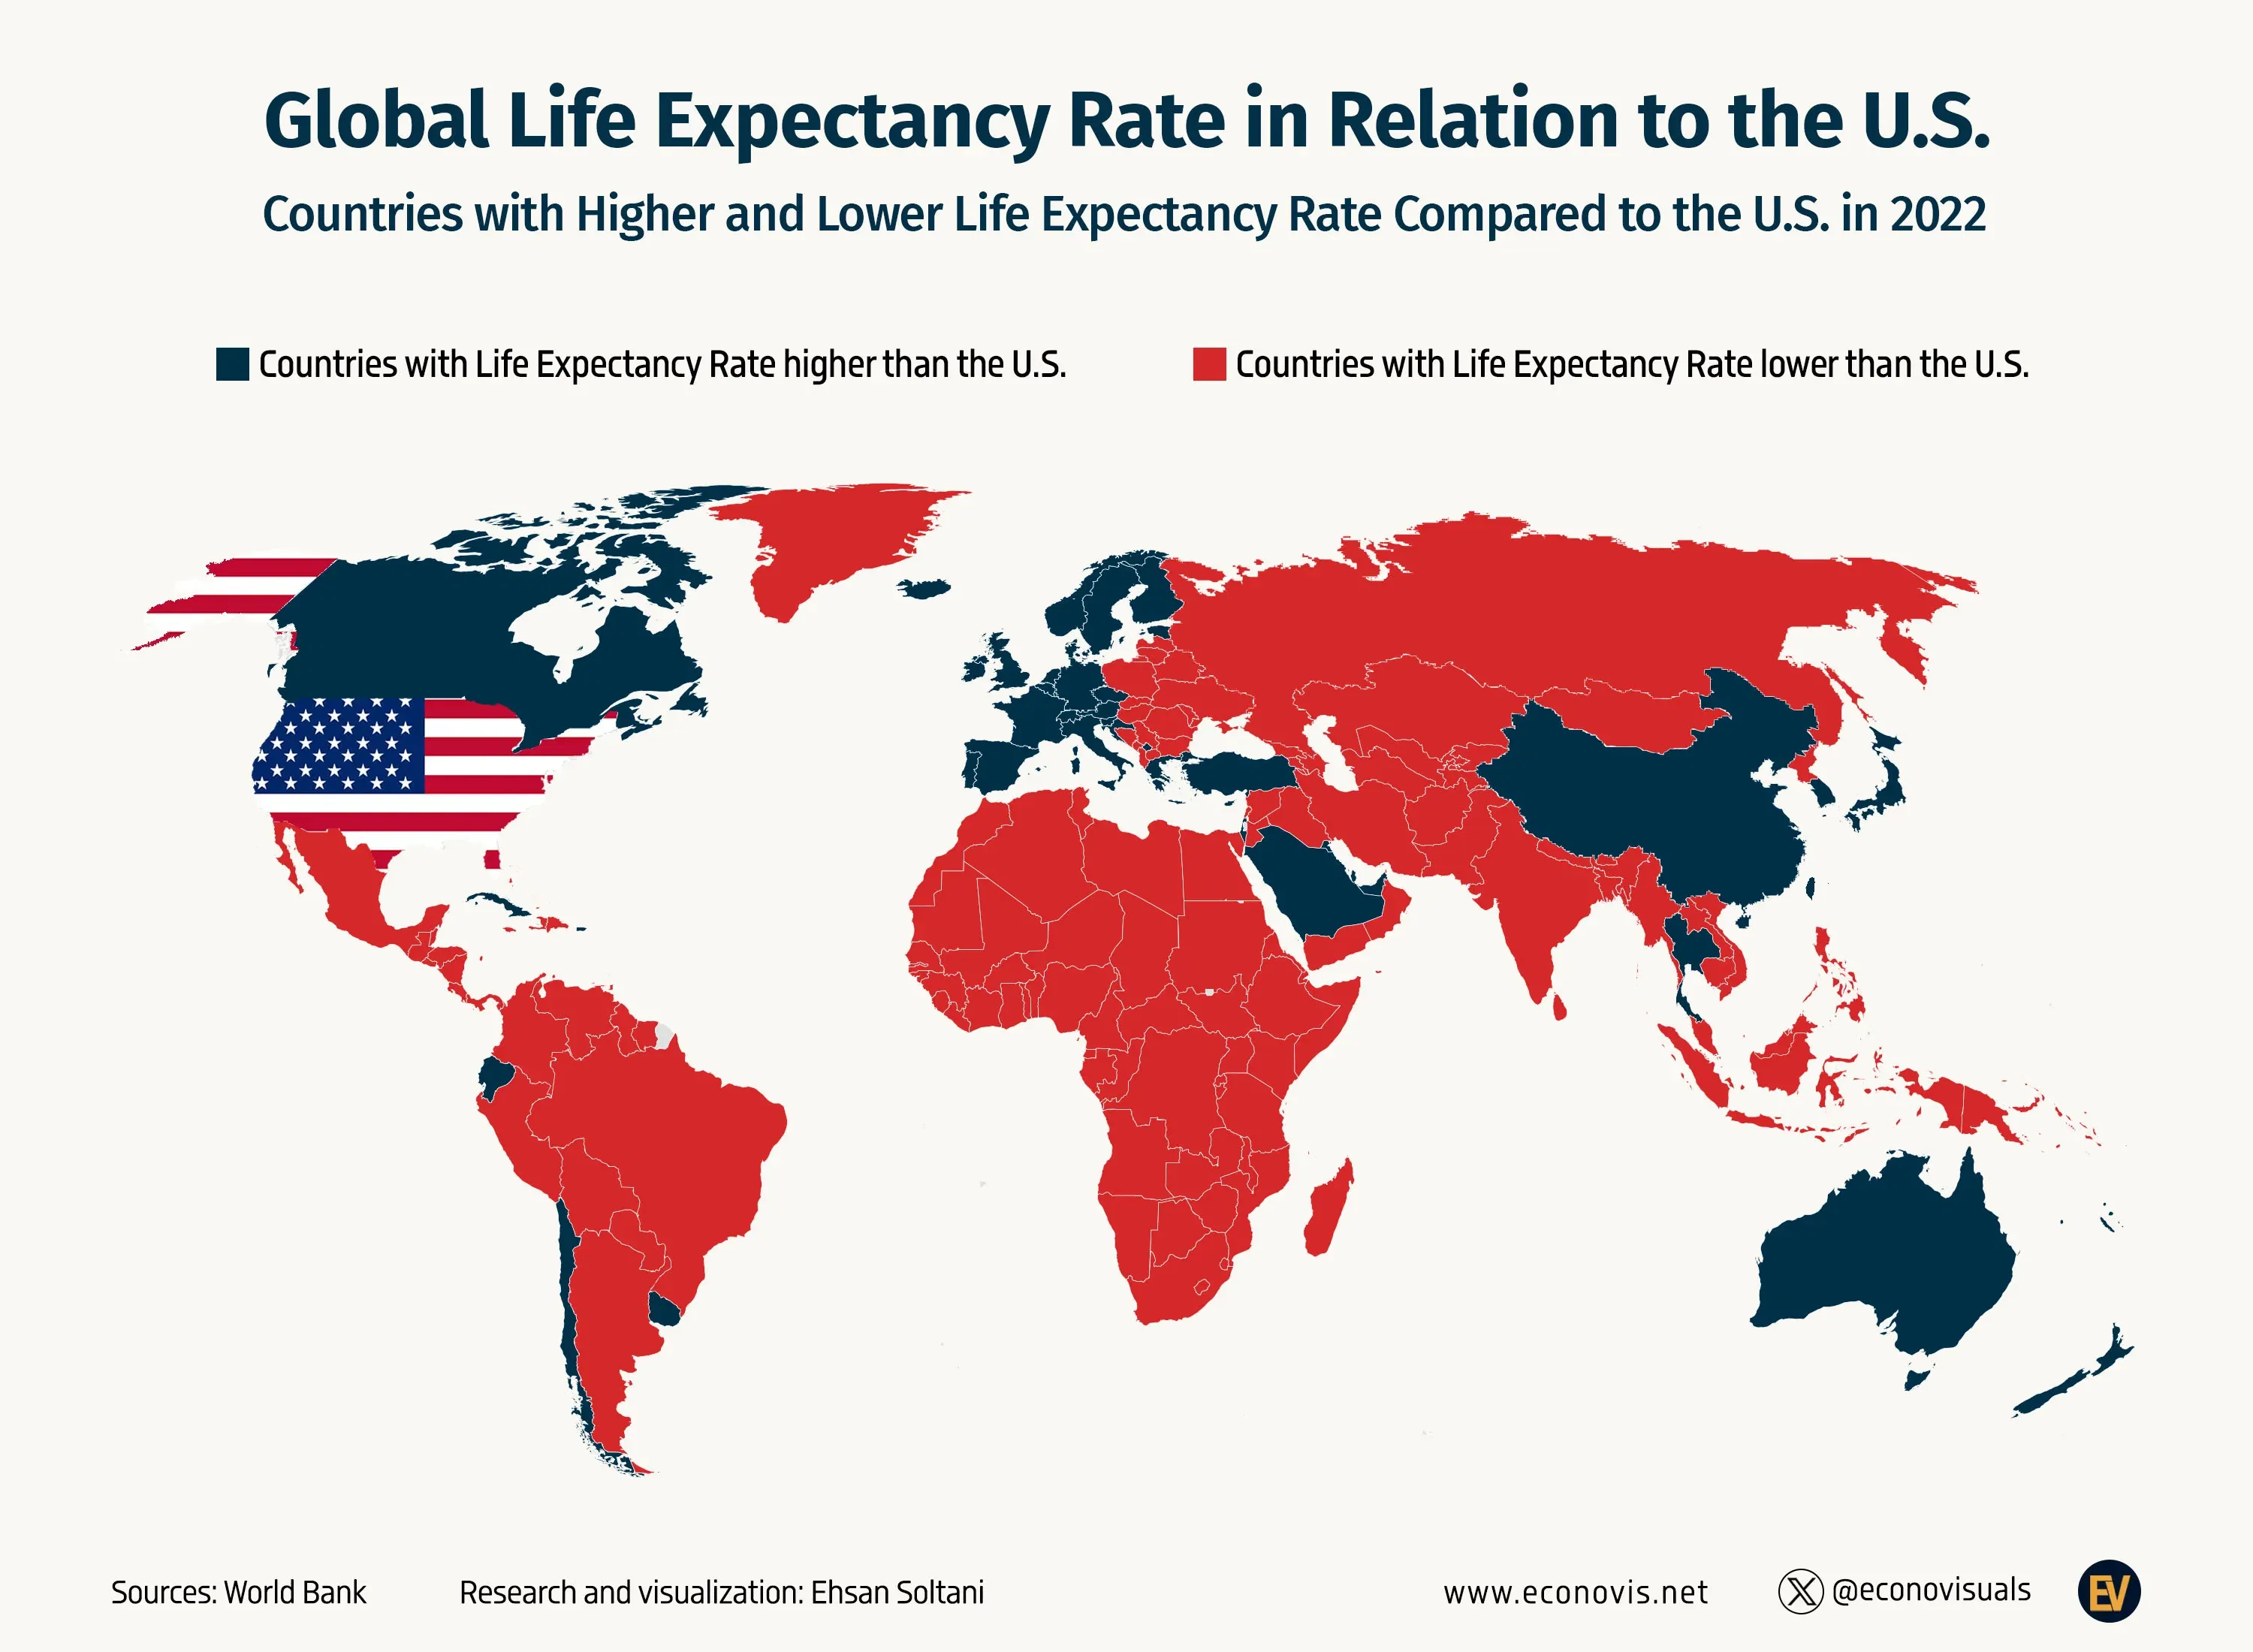
📈 Global Life Expectancy Rate in Relation to the U.S.
Countries with Higher and Lower Life Expectancy Rate Compared to the U.S. in 2022
Life expectancy in the United States lags behind not only advanced economies but also several developing countries. Nations like Chile, China, Cuba, Kuwait, Saudi Arabia, Thailand, and Turkey all boast higher life expectancy rates than the U.S. This disparity raises critical questions about the factors influencing longevity.
In advanced economies, comprehensive healthcare systems, better access to medical services, and healthier lifestyles contribute significantly to higher life expectancy. However, the situation in developing countries with higher life expectancies than the U.S. suggests that other factors are at play. For instance, social determinants of health such as income inequality, education levels, and public health initiatives can heavily influence overall life expectancy.
The U.S. faces unique challenges, including higher rates of chronic diseases, obesity, and disparities in healthcare access. Moreover, lifestyle factors such as diet, exercise, and substance abuse also impact longevity. Addressing these issues requires a multifaceted approach, focusing on improving healthcare accessibility, promoting healthier lifestyles, and reducing socioeconomic disparities.
Dataset
Life Expectancy Rate 2022 | ||
---|---|---|
Years | ||
1 | Macao SAR, China | 85.4 |
2 | Liechtenstein | 84.3 |
3 | Japan | 84.0 |
4 | Hong Kong SAR, China | 83.7 |
5 | French Polynesia | 83.6 |
6 | Switzerland | 83.5 |
7 | Faroe Islands | 83.3 |
8 | Australia | 83.2 |
9 | Sweden | 83.1 |
10 | Spain | 83.1 |
11 | Ireland | 83.1 |
12 | Luxembourg | 83.0 |
13 | Italy | 82.9 |
14 | Singapore | 82.9 |
15 | Gibraltar | 82.8 |
16 | New Zealand | 82.8 |
17 | Israel | 82.7 |
18 | Malta | 82.7 |
19 | South Korea | 82.7 |
20 | Norway | 82.6 |
21 | France | 82.2 |
22 | Iceland | 82.2 |
23 | United Kingdom | 82.1 |
24 | Cyprus | 81.9 |
25 | Netherlands | 81.7 |
26 | Euro area | 81.7 |
27 | Belgium | 81.7 |
28 | Channel Islands | 81.6 |
29 | Portugal | 81.6 |
30 | Bermuda | 81.6 |
31 | Qatar | 81.6 |
32 | Denmark | 81.3 |
33 | Canada | 81.3 |
34 | Slovenia | 81.3 |
35 | Finland | 81.2 |
36 | Austria | 81.1 |
37 | New Caledonia | 81.0 |
38 | Maldives | 80.8 |
39 | European Union | 80.8 |
40 | Isle of Man | 80.8 |
41 | Germany | 80.7 |
42 | Greece | 80.6 |
43 | St. Martin (French part) | 80.6 |
44 | Virgin Islands (U.S.) | 80.3 |
45 | Kuwait | 80.3 |
46 | Post-demographic dividend | 80.2 |
47 | Puerto Rico | 79.7 |
48 | Thailand | 79.7 |
49 | OECD members | 79.6 |
50 | Kosovo | 79.5 |
51 | Chile | 79.5 |
52 | High income | 79.5 |
53 | Bahrain | 79.2 |
54 | Antigua and Barbuda | 79.2 |
55 | United Arab Emirates | 79.2 |
56 | Czechia | 79.0 |
57 | China | 78.6 |
58 | Turkiye | 78.5 |
59 | Guam | 78.3 |
60 | Cuba | 78.2 |
61 | Uruguay | 78.0 |
62 | Estonia | 77.9 |
63 | Saudi Arabia | 77.9 |
64 | Ecuador | 77.9 |
65 | Europe & Central Asia | 77.8 |
66 | North America | 77.8 |
67 | Barbados | 77.7 |
68 | Croatia | 77.6 |
69 | United States | 77.4 |
70 | Costa Rica | 77.3 |
71 | Poland | 77.3 |
72 | Algeria | 77.1 |
73 | Late-demographic dividend | 77.1 |
74 | Slovak Republic | 77.1 |
75 | East Asia & Pacific | 76.9 |
76 | Albania | 76.8 |
77 | Panama | 76.8 |
78 | Central Europe and the Baltics | 76.8 |
79 | Sri Lanka | 76.6 |
80 | British Virgin Islands | 76.4 |
81 | Malaysia | 76.3 |
82 | East Asia & Pacific (IDA & IBRD countries) | 76.2 |
83 | Montenegro | 76.2 |
84 | East Asia & Pacific (excluding high income) | 76.2 |
85 | Argentina | 76.1 |
86 | Hungary | 76.0 |
87 | Lithuania | 75.8 |
88 | Upper middle income | 75.7 |
89 | Serbia | 75.5 |
90 | Grenada | 75.3 |
91 | Romania | 75.3 |
92 | Bosnia and Herzegovina | 75.3 |
93 | Aruba | 75.0 |
94 | Morocco | 75.0 |
95 | Turks and Caicos Islands | 74.9 |
96 | Mexico | 74.8 |
97 | Cabo Verde | 74.7 |
98 | Trinidad and Tobago | 74.7 |
99 | Nicaragua | 74.6 |
100 | Latvia | 74.6 |
101 | Viet Nam | 74.6 |
102 | Iran | 74.6 |
103 | Brunei Darussalam | 74.6 |
104 | Kazakhstan | 74.4 |
105 | North Macedonia | 74.4 |
106 | Lebanon | 74.4 |
107 | Sint Maarten (Dutch part) | 74.4 |
108 | Bulgaria | 74.4 |
109 | Bahamas, The | 74.4 |
110 | Tunisia | 74.3 |
111 | Jordan | 74.2 |
112 | Dominican Republic | 74.2 |
113 | Europe & Central Asia (excluding high income) | 74.1 |
114 | Europe & Central Asia (IDA & IBRD countries) | 74.0 |
115 | Oman | 73.9 |
116 | Seychelles | 73.8 |
117 | Latin America & Caribbean | 73.8 |
118 | Bangladesh | 73.7 |
119 | Colombia | 73.7 |
120 | Latin America & the Caribbean (IDA & IBRD countries) | 73.6 |
121 | Latin America & Caribbean (excluding high income) | 73.6 |
122 | North Korea | 73.6 |
123 | Mauritius | 73.5 |
124 | Azerbaijan | 73.5 |
125 | West Bank and Gaza | 73.4 |
126 | Brazil | 73.4 |
127 | Peru | 73.4 |
128 | Armenia | 73.4 |
129 | Middle East & North Africa | 73.2 |
130 | Belarus | 73.1 |
131 | Dominica | 73.0 |
132 | IBRD only | 72.9 |
133 | Other small states | 72.9 |
134 | Mongolia | 72.7 |
135 | Samoa | 72.6 |
136 | Russian Federation | 72.5 |
137 | Syrian Arab Republic | 72.3 |
138 | Middle East & North Africa (excluding high income) | 72.3 |
139 | Middle East & North Africa (IDA & IBRD countries) | 72.3 |
140 | Bhutan | 72.2 |
141 | Philippines | 72.2 |
142 | Small states | 72.2 |
143 | Libya | 72.2 |
144 | Kyrgyz Republic | 72.0 |
145 | St. Kitts and Nevis | 72.0 |
146 | World | 72.0 |
147 | Uzbekistan | 71.7 |
148 | Georgia | 71.6 |
149 | Greenland | 71.5 |
150 | El Salvador | 71.5 |
151 | Iraq | 71.3 |
152 | St. Lucia | 71.3 |
153 | Tajikistan | 71.3 |
154 | Middle income | 71.3 |
155 | Tonga | 71.3 |
156 | Arab World | 71.2 |
157 | Venezuela | 71.1 |
158 | Caribbean small states | 71.0 |
159 | Belize | 71.0 |
160 | Micronesia, Fed. Sts. | 70.9 |
161 | Solomon Islands | 70.7 |
162 | Honduras | 70.7 |
163 | Jamaica | 70.6 |
164 | IDA & IBRD total | 70.5 |
165 | Vanuatu | 70.5 |
166 | Nepal | 70.5 |
167 | Paraguay | 70.5 |
168 | Low & middle income | 70.4 |
169 | Suriname | 70.3 |
170 | Egypt | 70.2 |
171 | Cambodia | 69.9 |
172 | Pacific island small states | 69.7 |
173 | Turkmenistan | 69.4 |
174 | Early-demographic dividend | 69.3 |
175 | Timor-Leste | 69.1 |
176 | Lao PDR | 69.0 |
177 | St. Vincent and the Grenadines | 69.0 |
178 | Sao Tome and Principe | 68.8 |
179 | Guatemala | 68.7 |
180 | Moldova | 68.6 |
181 | Ukraine | 68.6 |
182 | Fiji | 68.3 |
183 | Indonesia | 68.3 |
184 | South Asia | 68.2 |
185 | South Asia (IDA & IBRD) | 68.2 |
186 | Senegal | 67.9 |
187 | India | 67.7 |
188 | Kiribati | 67.7 |
189 | Myanmar | 67.3 |
190 | Lower middle income | 67.2 |
191 | Rwanda | 67.1 |
192 | Tanzania | 66.8 |
193 | Eritrea | 66.6 |
194 | Pakistan | 66.4 |
195 | Guyana | 66.0 |
196 | Papua New Guinea | 66.0 |
197 | Botswana | 65.9 |
198 | Gabon | 65.7 |
199 | Ethiopia | 65.6 |
200 | Sudan | 65.6 |
201 | IDA only | 65.4 |
202 | Madagascar | 65.2 |
203 | Marshall Islands | 65.1 |
204 | Bolivia | 64.9 |
205 | Least developed countries | UN classification |
206 | Tuvalu | 64.9 |
207 | Mauritania | 64.7 |
208 | IDA total | 64.0 |
209 | Nauru | 64.0 |
210 | Ghana | 63.9 |
211 | Haiti | 63.7 |
212 | Yemen | 63.7 |
213 | Comoros | 63.7 |
214 | Uganda | 63.6 |
215 | Congo, Rep. | 63.1 |
216 | Low income | 63.0 |
217 | Gambia, The | 62.9 |
218 | Africa Eastern and Southern | 62.9 |
219 | Malawi | 62.9 |
220 | Afghanistan | 62.9 |
221 | Djibouti | 62.9 |
222 | Heavily indebted poor countries (HIPC) | 62.8 |
223 | Niger | 62.1 |
224 | Kenya | 62.1 |
225 | Burundi | 62.0 |
226 | Angola | 61.9 |
227 | Zambia | 61.8 |
228 | Fragile and conflict affected situations | 61.8 |
229 | Togo | 61.6 |
230 | South Africa | 61.5 |
231 | IDA blend | 61.3 |
232 | Equatorial Guinea | 61.2 |
233 | Liberia | 61.1 |
234 | Cameroon | 61.0 |
235 | Sub-Saharan Africa | 60.8 |
236 | Sub-Saharan Africa (IDA & IBRD countries) | 60.8 |
237 | Sub-Saharan Africa (excluding high income) | 60.8 |
238 | Pre-demographic dividend | 60.5 |
239 | Sierra Leone | 60.4 |
240 | Benin | 60.0 |
241 | Guinea-Bissau | 59.9 |
242 | Burkina Faso | 59.8 |
243 | Democratic Republic of Congo | 59.7 |
244 | Mozambique | 59.6 |
245 | Mali | 59.4 |
246 | Zimbabwe | 59.4 |
247 | Guinea | 59.0 |
248 | Cote d'Ivoire | 58.9 |
249 | Namibia | 58.1 |
250 | Africa Western and Central | 57.6 |
251 | Eswatini | 56.4 |
252 | Somalia | 56.1 |
253 | South Sudan | 55.6 |
254 | Central African Republic | 54.5 |
255 | Nigeria | 53.6 |
256 | Lesotho | 53.0 |
257 | Chad | 53.0 |