What We’re Showing
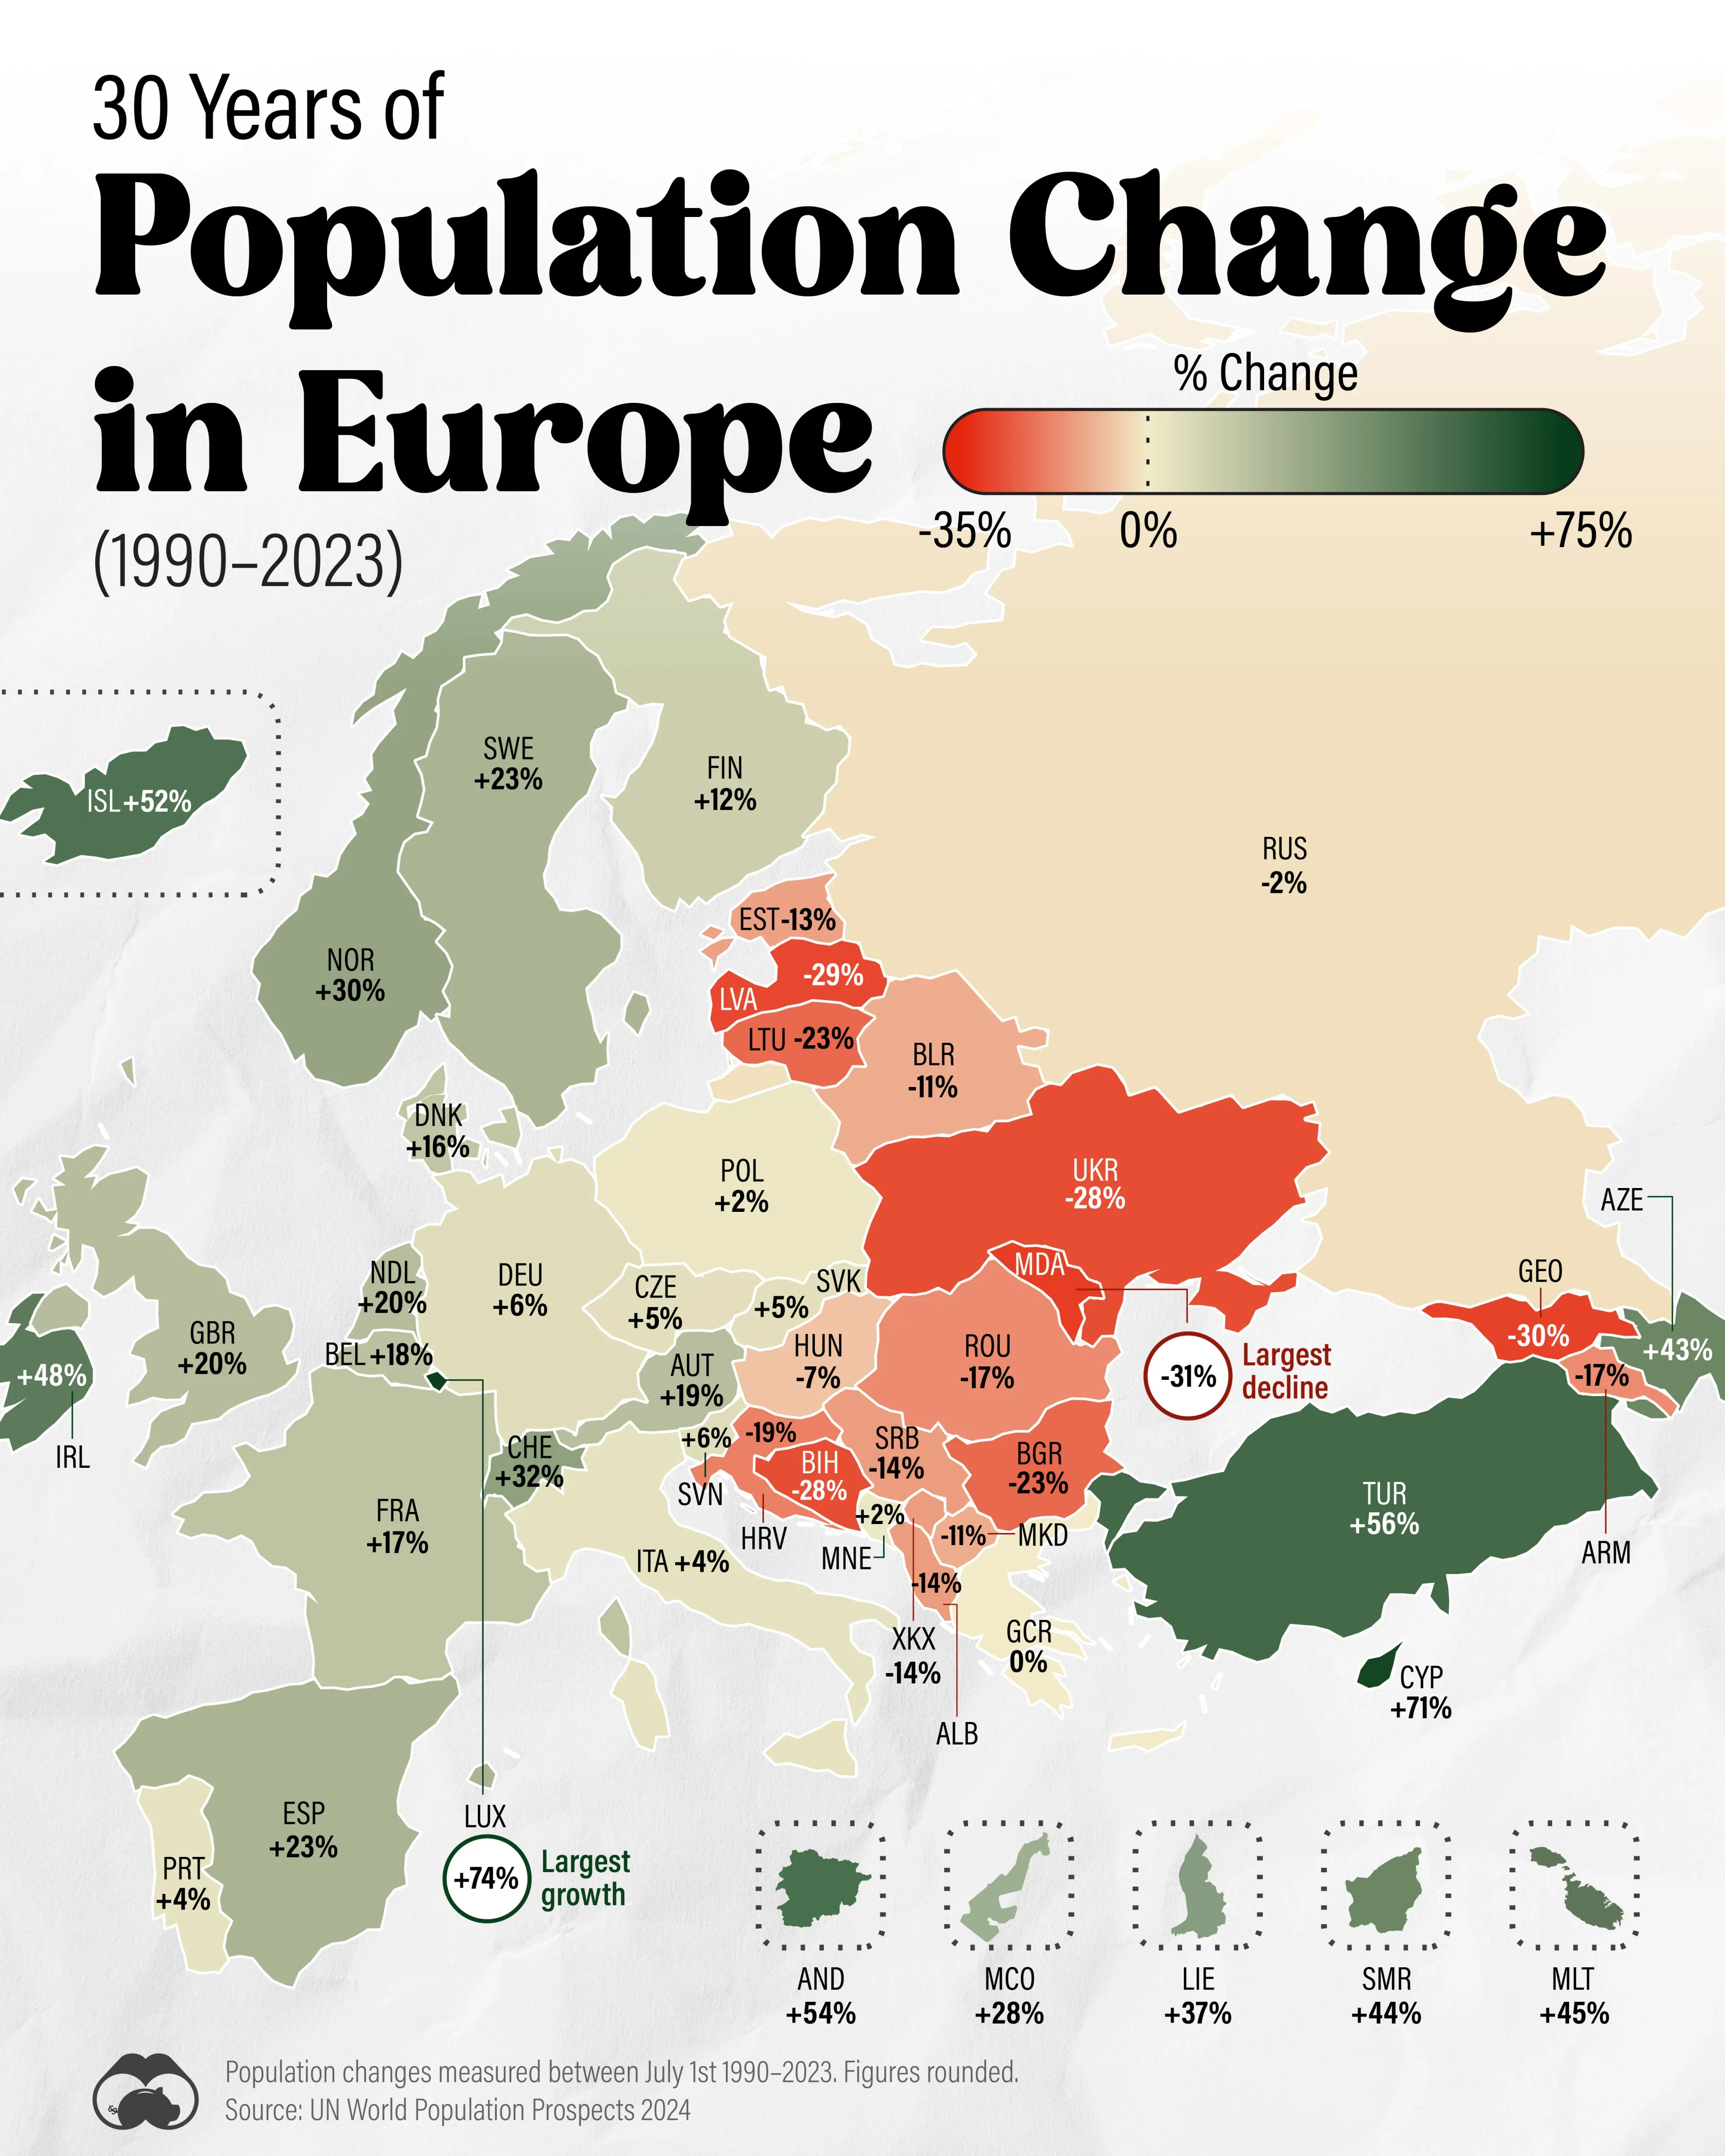
A map of Europe, color-coded by population growth (green) and declines (red) between 1990 and 2023. Data sourced from the UN’s World Population Prospects 2024.
Key Takeaways
- 🇷🇺 Russia and several former Soviet bloc countries have less people now than they did in 1990, when the Berlin Wall fell
- The Balkan countries have also seen population declines, after waves of emigration following the Yugoslav Wars
- Meanwhile, Western European countries have seen significant population growth, even as birth rates have fallen, indicating migration into the region.
- 🇱🇺 Luxembourg (+74%) has seen the most growth overall
- 🇲🇩 Moldova (-31%) has seen the largest decline
- 🇹🇷 Türkiye (+56%) and 🇮🇪 Ireland (+52%) have registered the most growth for countries with more than 1 million people