
Mapped: Government Debt Across the EU
Across Europe, protests over education, housing affordability and the cost of living are putting pressure on governments to deliver better public services and improve economic prospects for younger generations. Though many governments face competing demands on public finances, from social spending and infrastructure to defence and debt servicing.
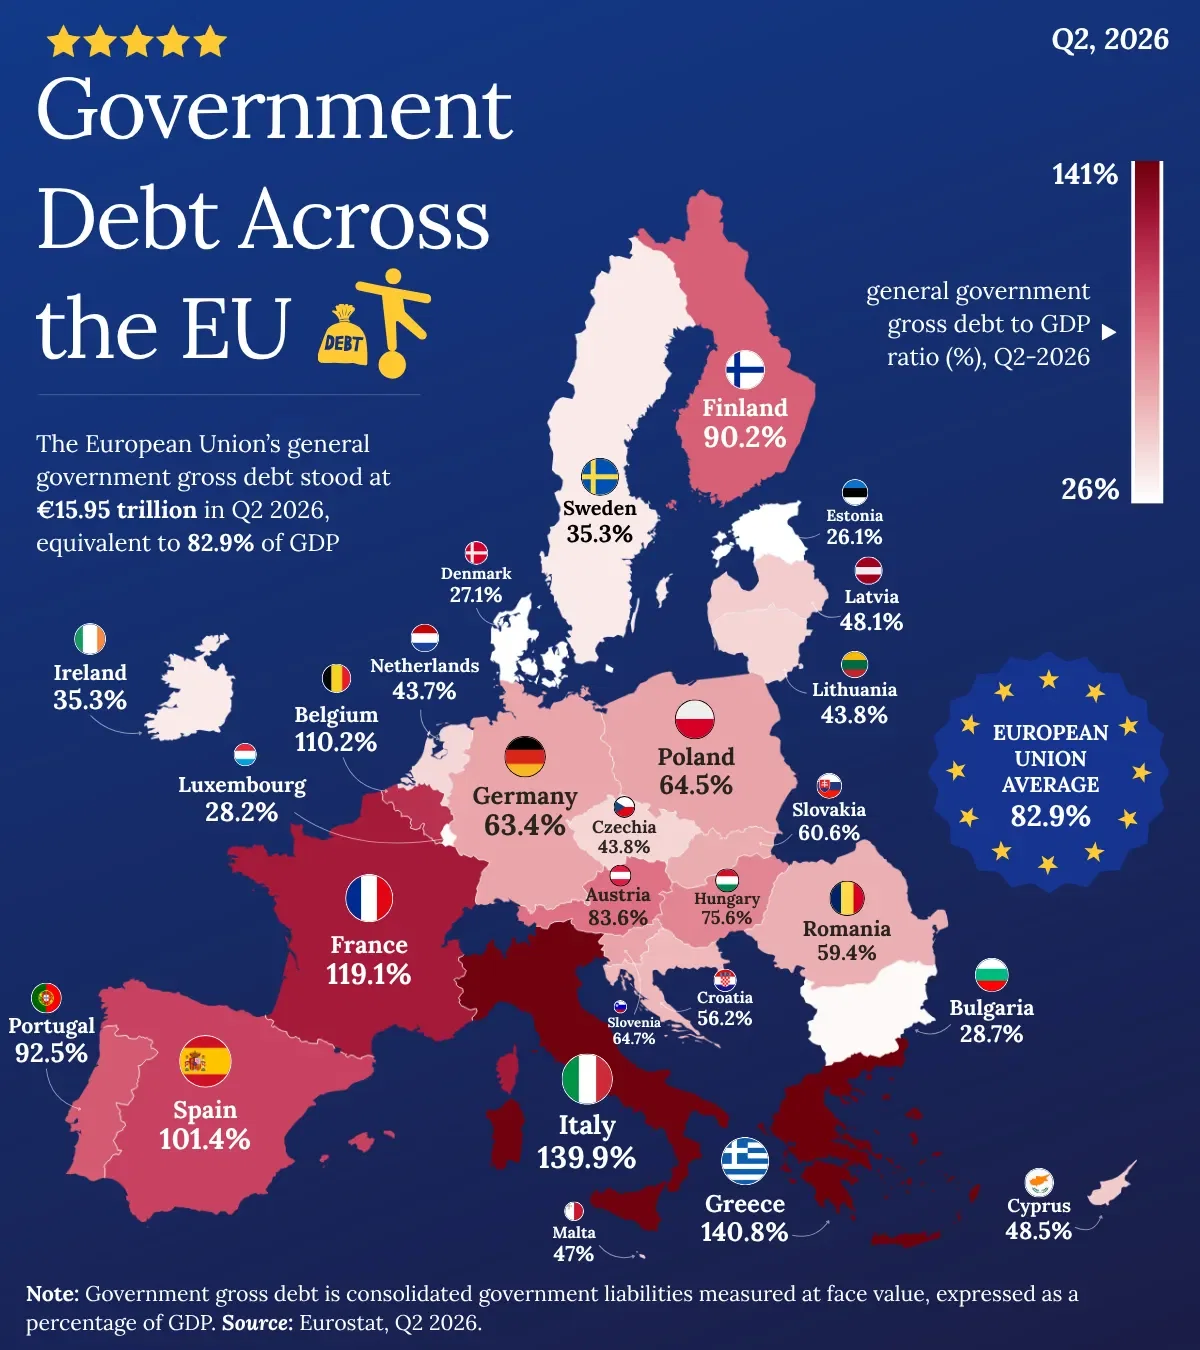
The EU’s general government gross debt stood at €15.95 trillion in Q2 2026, equivalent to 82.9% of GDP. The burden varies considerably across member states, with Greece and Italy near 140% of GDP and France at 119.1%. High debt and persistent deficits have constrained fiscal choices, raised questions about how governments will finance future investment in education, skills and other areas critical to long-term growth.
The map compares general government gross debt as a percentage of GDP across the 27 EU member states in Q2 2026, alongside the EU-wide average.
Key Takeaways:
- Greece had the EU’s highest debt-to-GDP ratio at 140.8%, narrowly ahead of Italy at 139.9%.
- France ranked among the most heavily indebted members, with government debt equivalent to 119.1% of GDP.
- Belgium (110.2%) and Spain (101.4%) were the other EU countries with debt ratios above 100%, alongside France, Greece and Italy.
- Portugal (92.5%) and Finland (90.2%) also recorded debt ratios well above the EU average of 82.9%.
- Germany’s debt ratio stood at 63.4%, below the EU average and substantially lower than those of France and Italy.
- At the lower end, Estonia recorded the EU’s lowest debt ratio at 26.1%, followed by Denmark at 27.1%, Luxembourg at 28.2% and Bulgaria at 28.7%.
Note: General government gross debt is consolidated government liabilities measured at face value, expressed as a percentage of GDP.
Source: Eurostat, Q2 2026.
Access data here: https://ec.europa.eu/eurostat/web/products-euro-indicators/w/2-21102026-bp
