Where Data Tells the Story
© Voronoi 2026. All rights reserved.
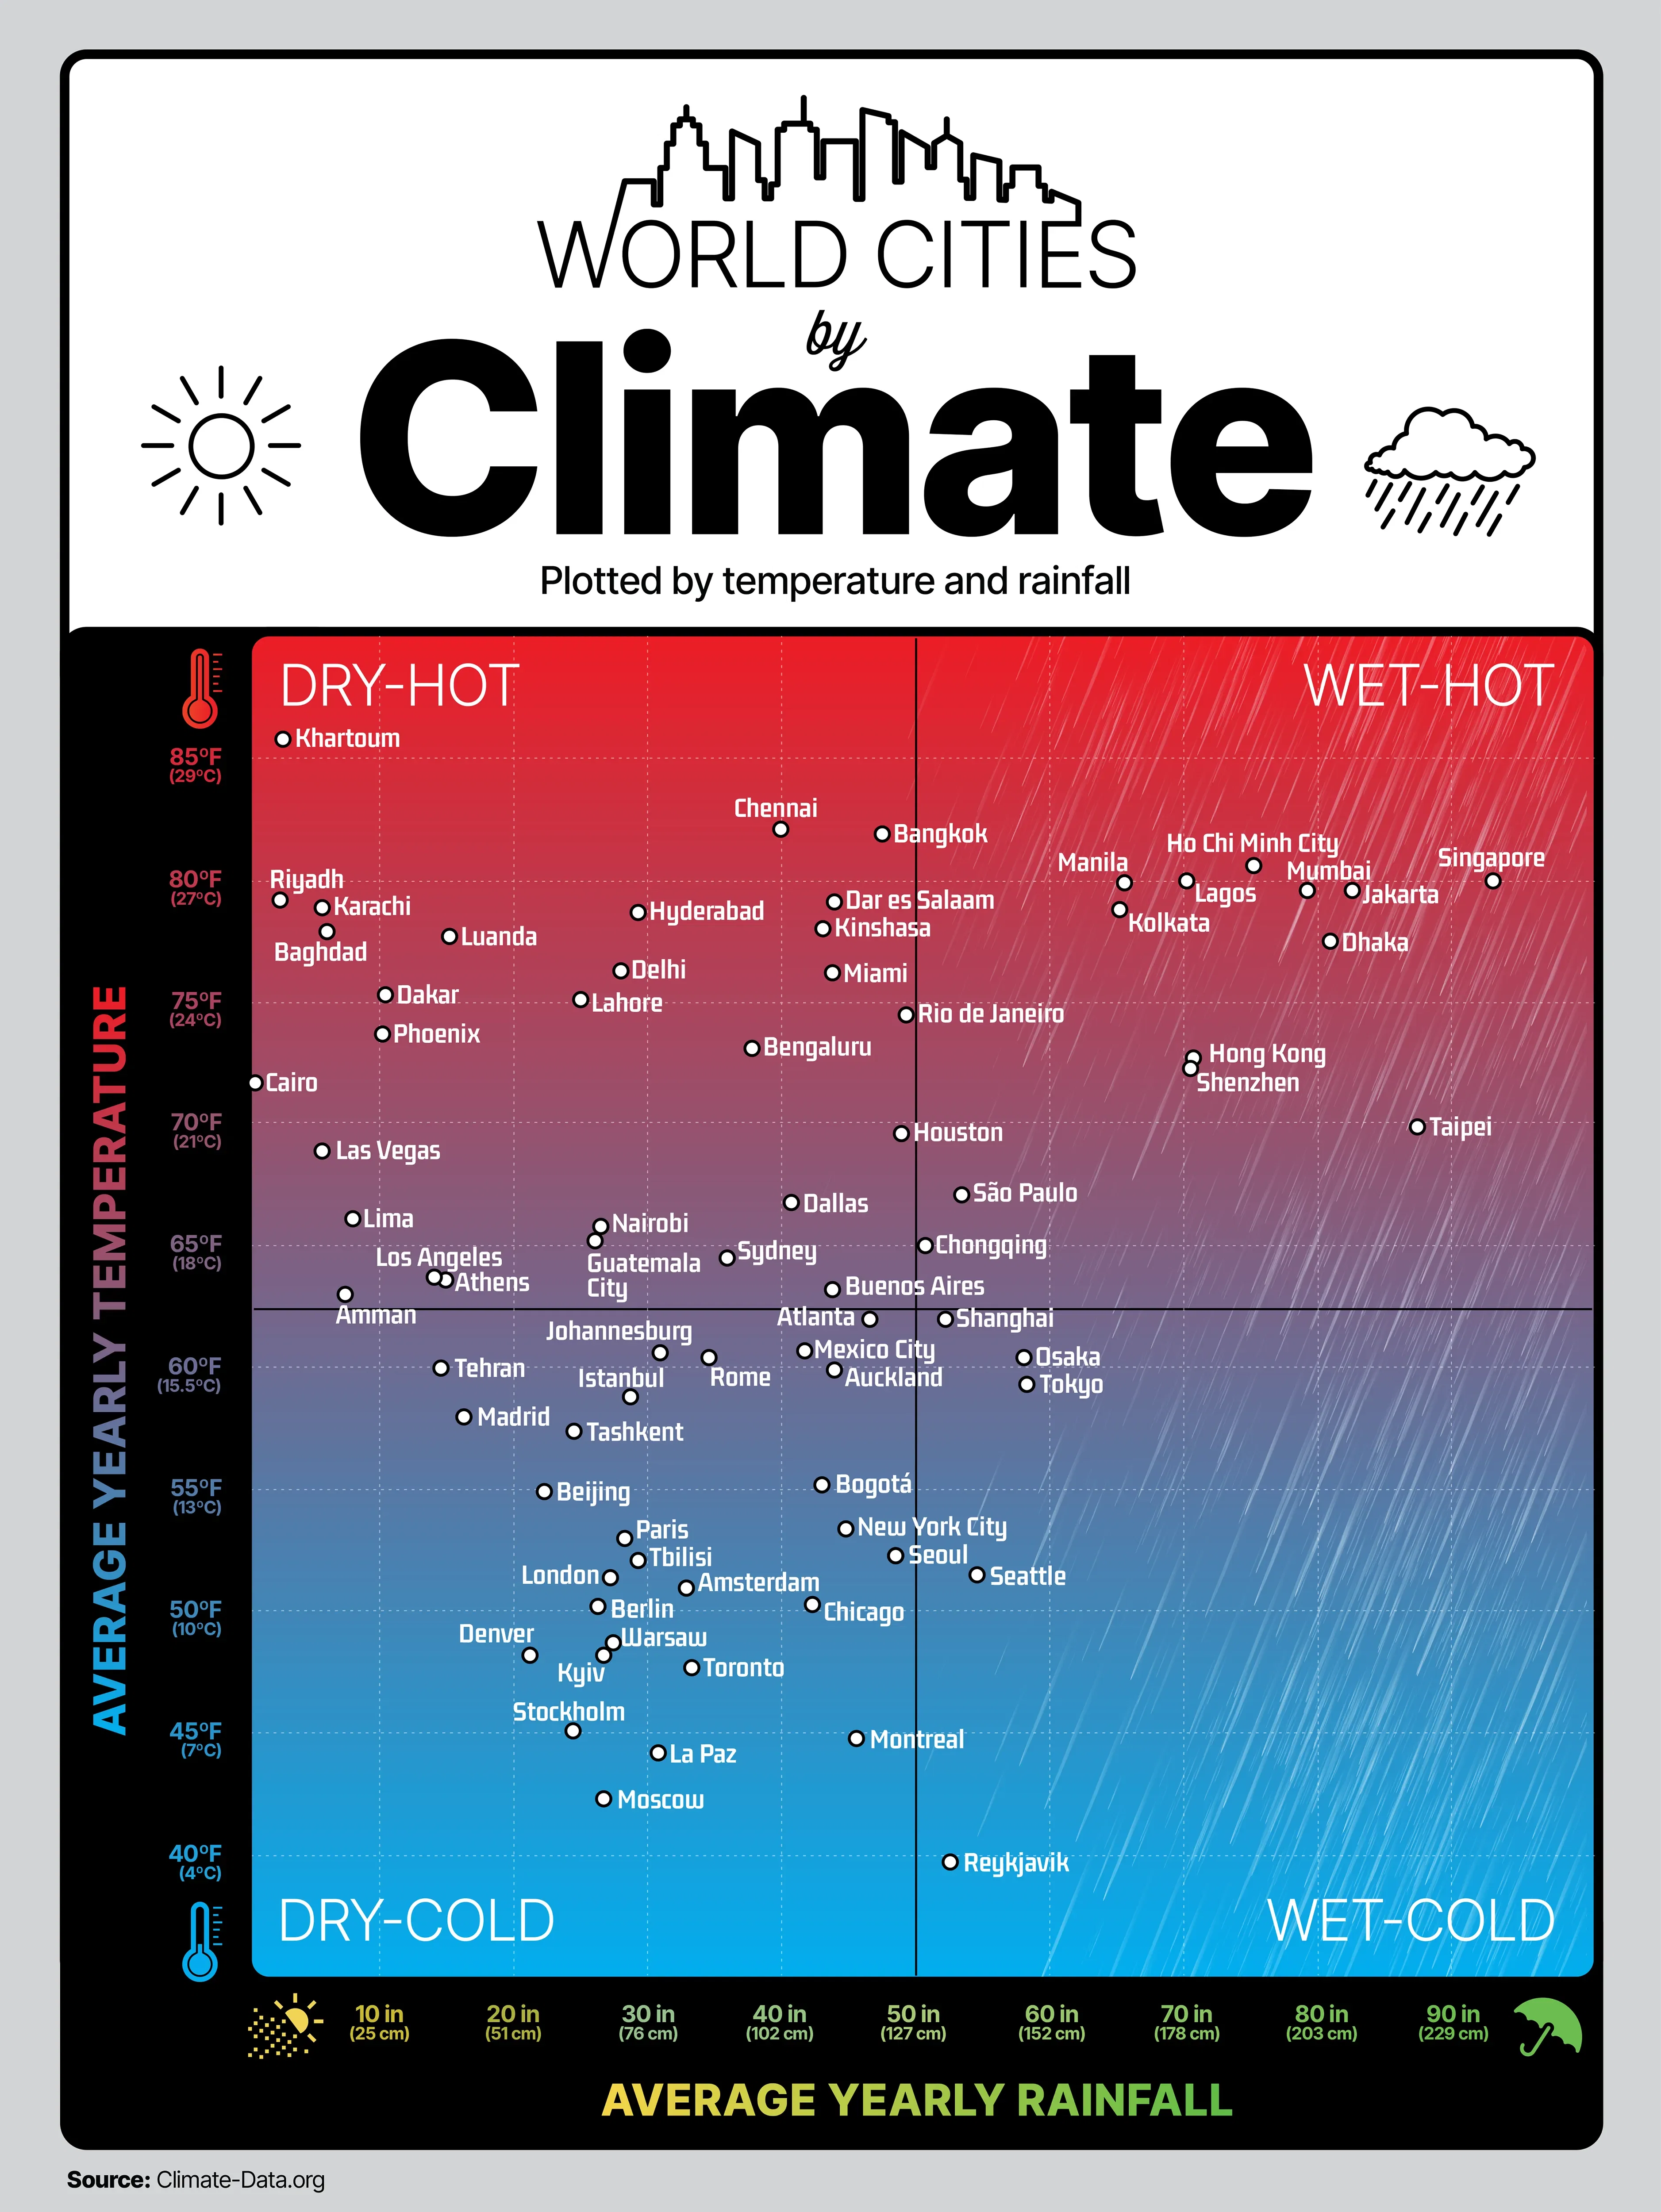
If you average the annual temperature and rainfall of major world cities, then plot them on a 2×2 grid—cold to hot, dry to wet—what patterns emerge?
Using data from Climate-Data.org, this chart maps 74 major cities across the globe. The upper-right quadrant (hot and wet) is dominated by cities in Asia and India. The lower-left quadrant (cold and dry) includes the greatest number of European cities. Most US cities fall on the drier half of the chart, with Seattle as the notable outlier. Very few cities are both cold and wet; Reykjavik, Iceland sits alone as the coldest in that quadrant. The hottest and driest cities tend to cluster in the Middle East, Africa, and parts of India.