Where Data Tells the Story
© Voronoi 2026. All rights reserved.
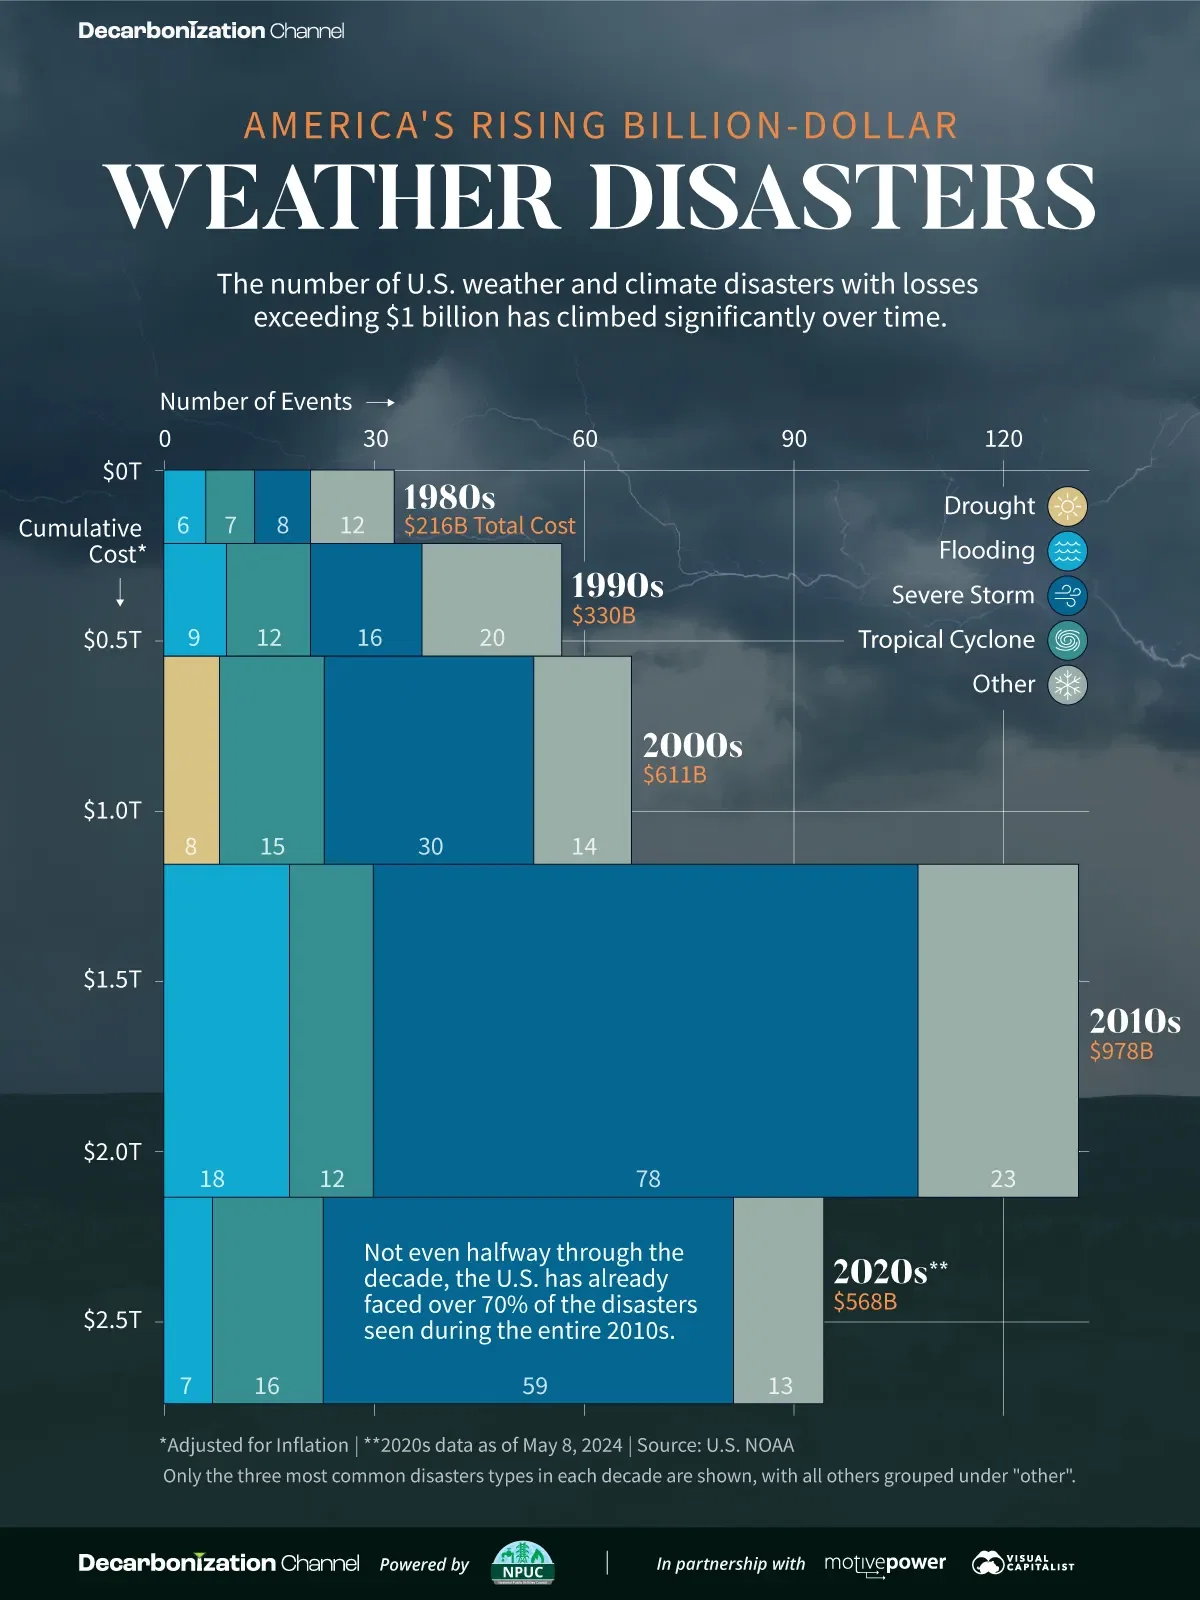
The number of weather and climate disasters with losses exceeding $1 billion, along with their inflation-adjusted cost, based on data from the U.S. NOAA. Longer bars indicate more disasters, and taller bars indicate higher costs.
Only the 3 most common types of disasters in each decade are shown separately in the chart, with all other disaster types grouped under "Other". Droughts occurred in decades other than the 2000s, but were not among the 3 most common disaster types.
Read the full article on the Decarbonization Channel, sponsored by the National Public Utilities Council.