Where Data Tells the Story
© Voronoi 2026. All rights reserved.
What we’re showing
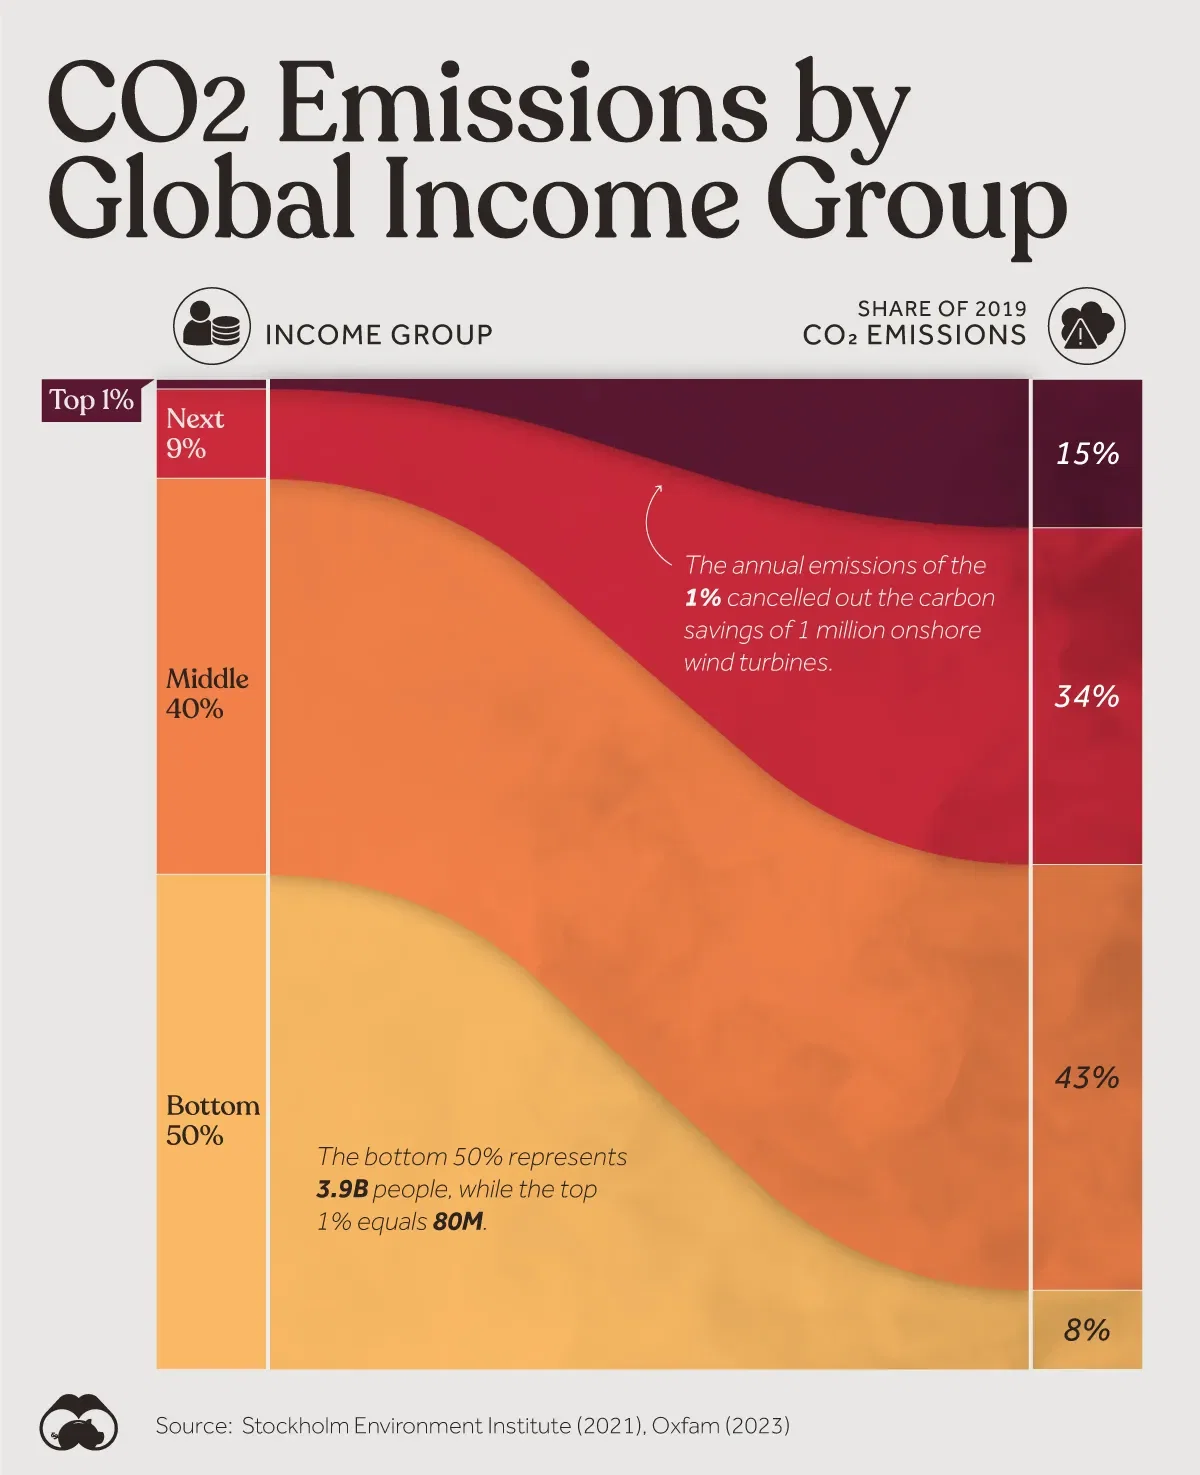
Global CO2 emissions in 2019, broken down by income group. This data comes from the Emissions Inequality Calculator, which was created by the Stockholm Environment Institute.
Important details
The average income* of each income group is:
*Units in 2011 purchasing power parity USD.