Where Data Tells the Story
© Voronoi 2026. All rights reserved.
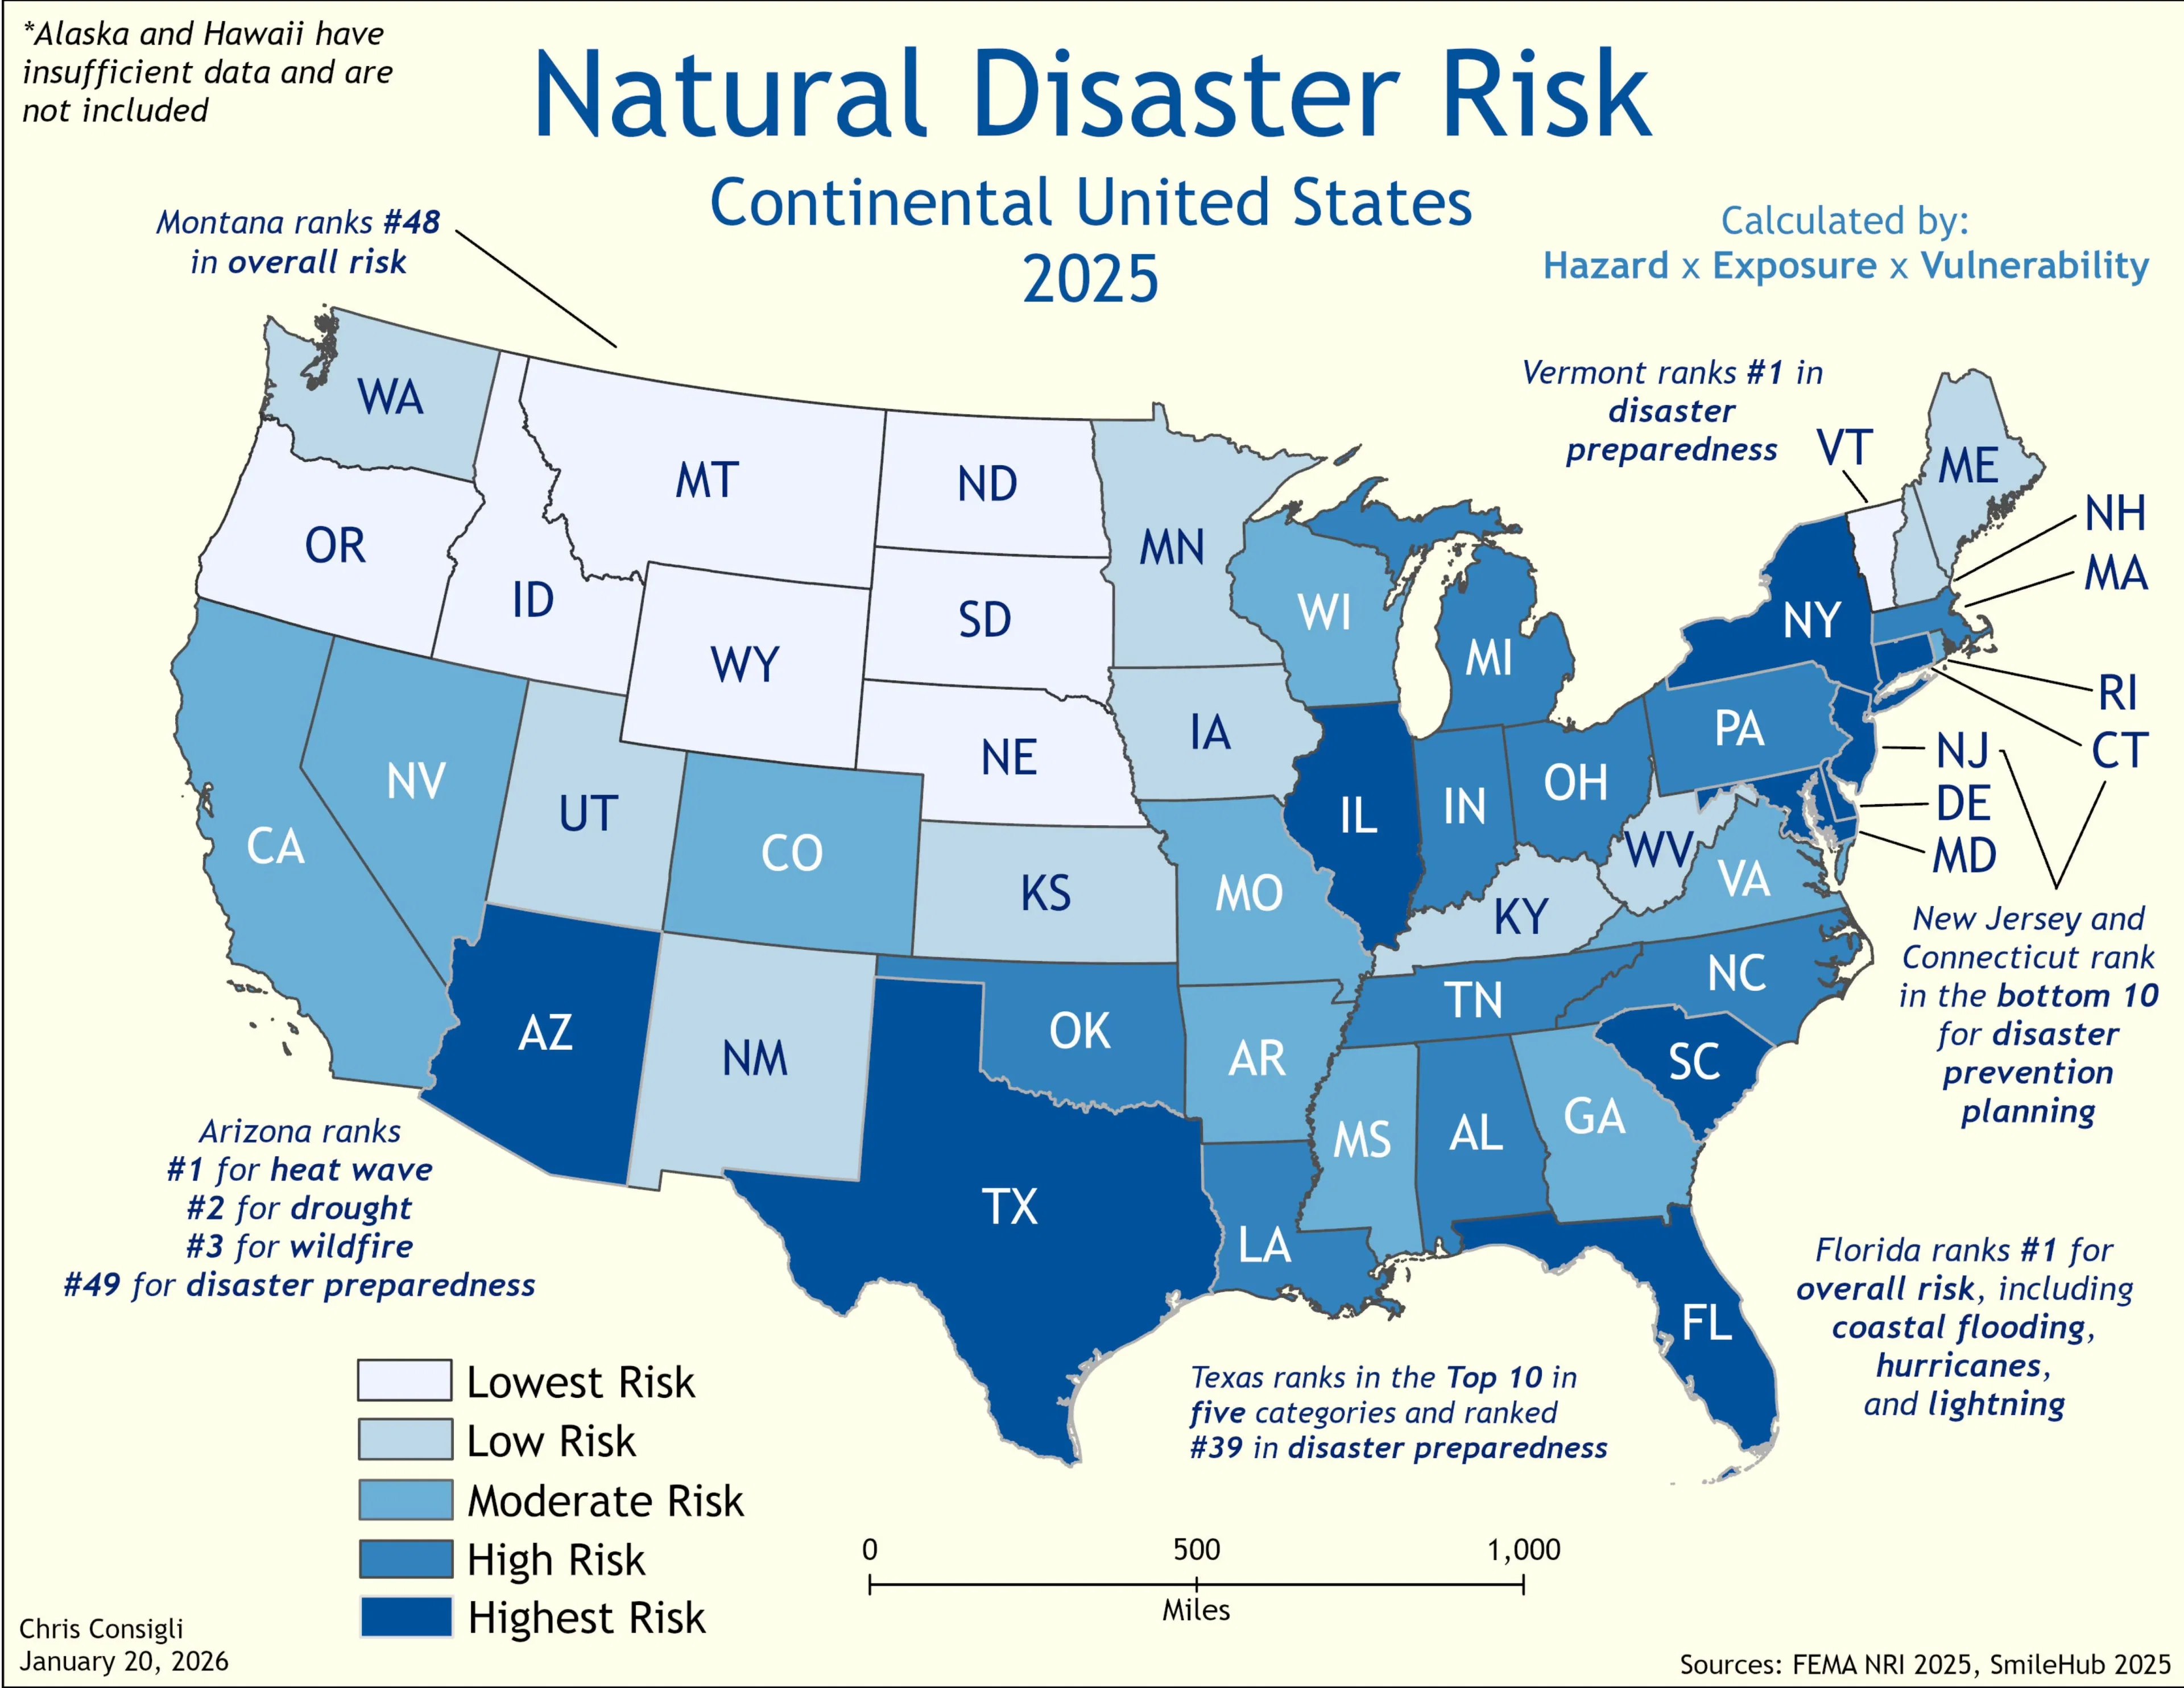
Methodology: The natural disaster risk assessment was based on the following formula: Hazard x Exposure x Vulnerability. A brief description of each factor is below.
Hazard: Annualized Frequency of each disaster (list below) (FEMA National Risk Index)
Exposure: Population and Total Building Value (FEMA National Risk Index)
Vulnerability: Composite score of Resilience Infrastructure, Disaster Prevention Planning, and Lasting Damage Rank (SmileHub Disaster Preparedness ranking). Since the study measured overall resilience, Vulnerability = 100 - Resilience Score
Natural Disasters measured in this analysis: Avalanche, Coastal Flooding, Cold Wave, Drought, Earthquake, Hail, Heat Wave, High Wind, Hurricane, Ice Storm, Landslide, Lightning, River Flooding, Tornado, Tsunami, Volcanic Eruption, Wildfire, Winter Weather.
In addition to the map comments, these are more key takeaways:
As climate concerns grow, resilient infrastructure and disaster prevention planning must become a central focus in high-risk states.