Where Data Tells the Story
© Voronoi 2026. All rights reserved.
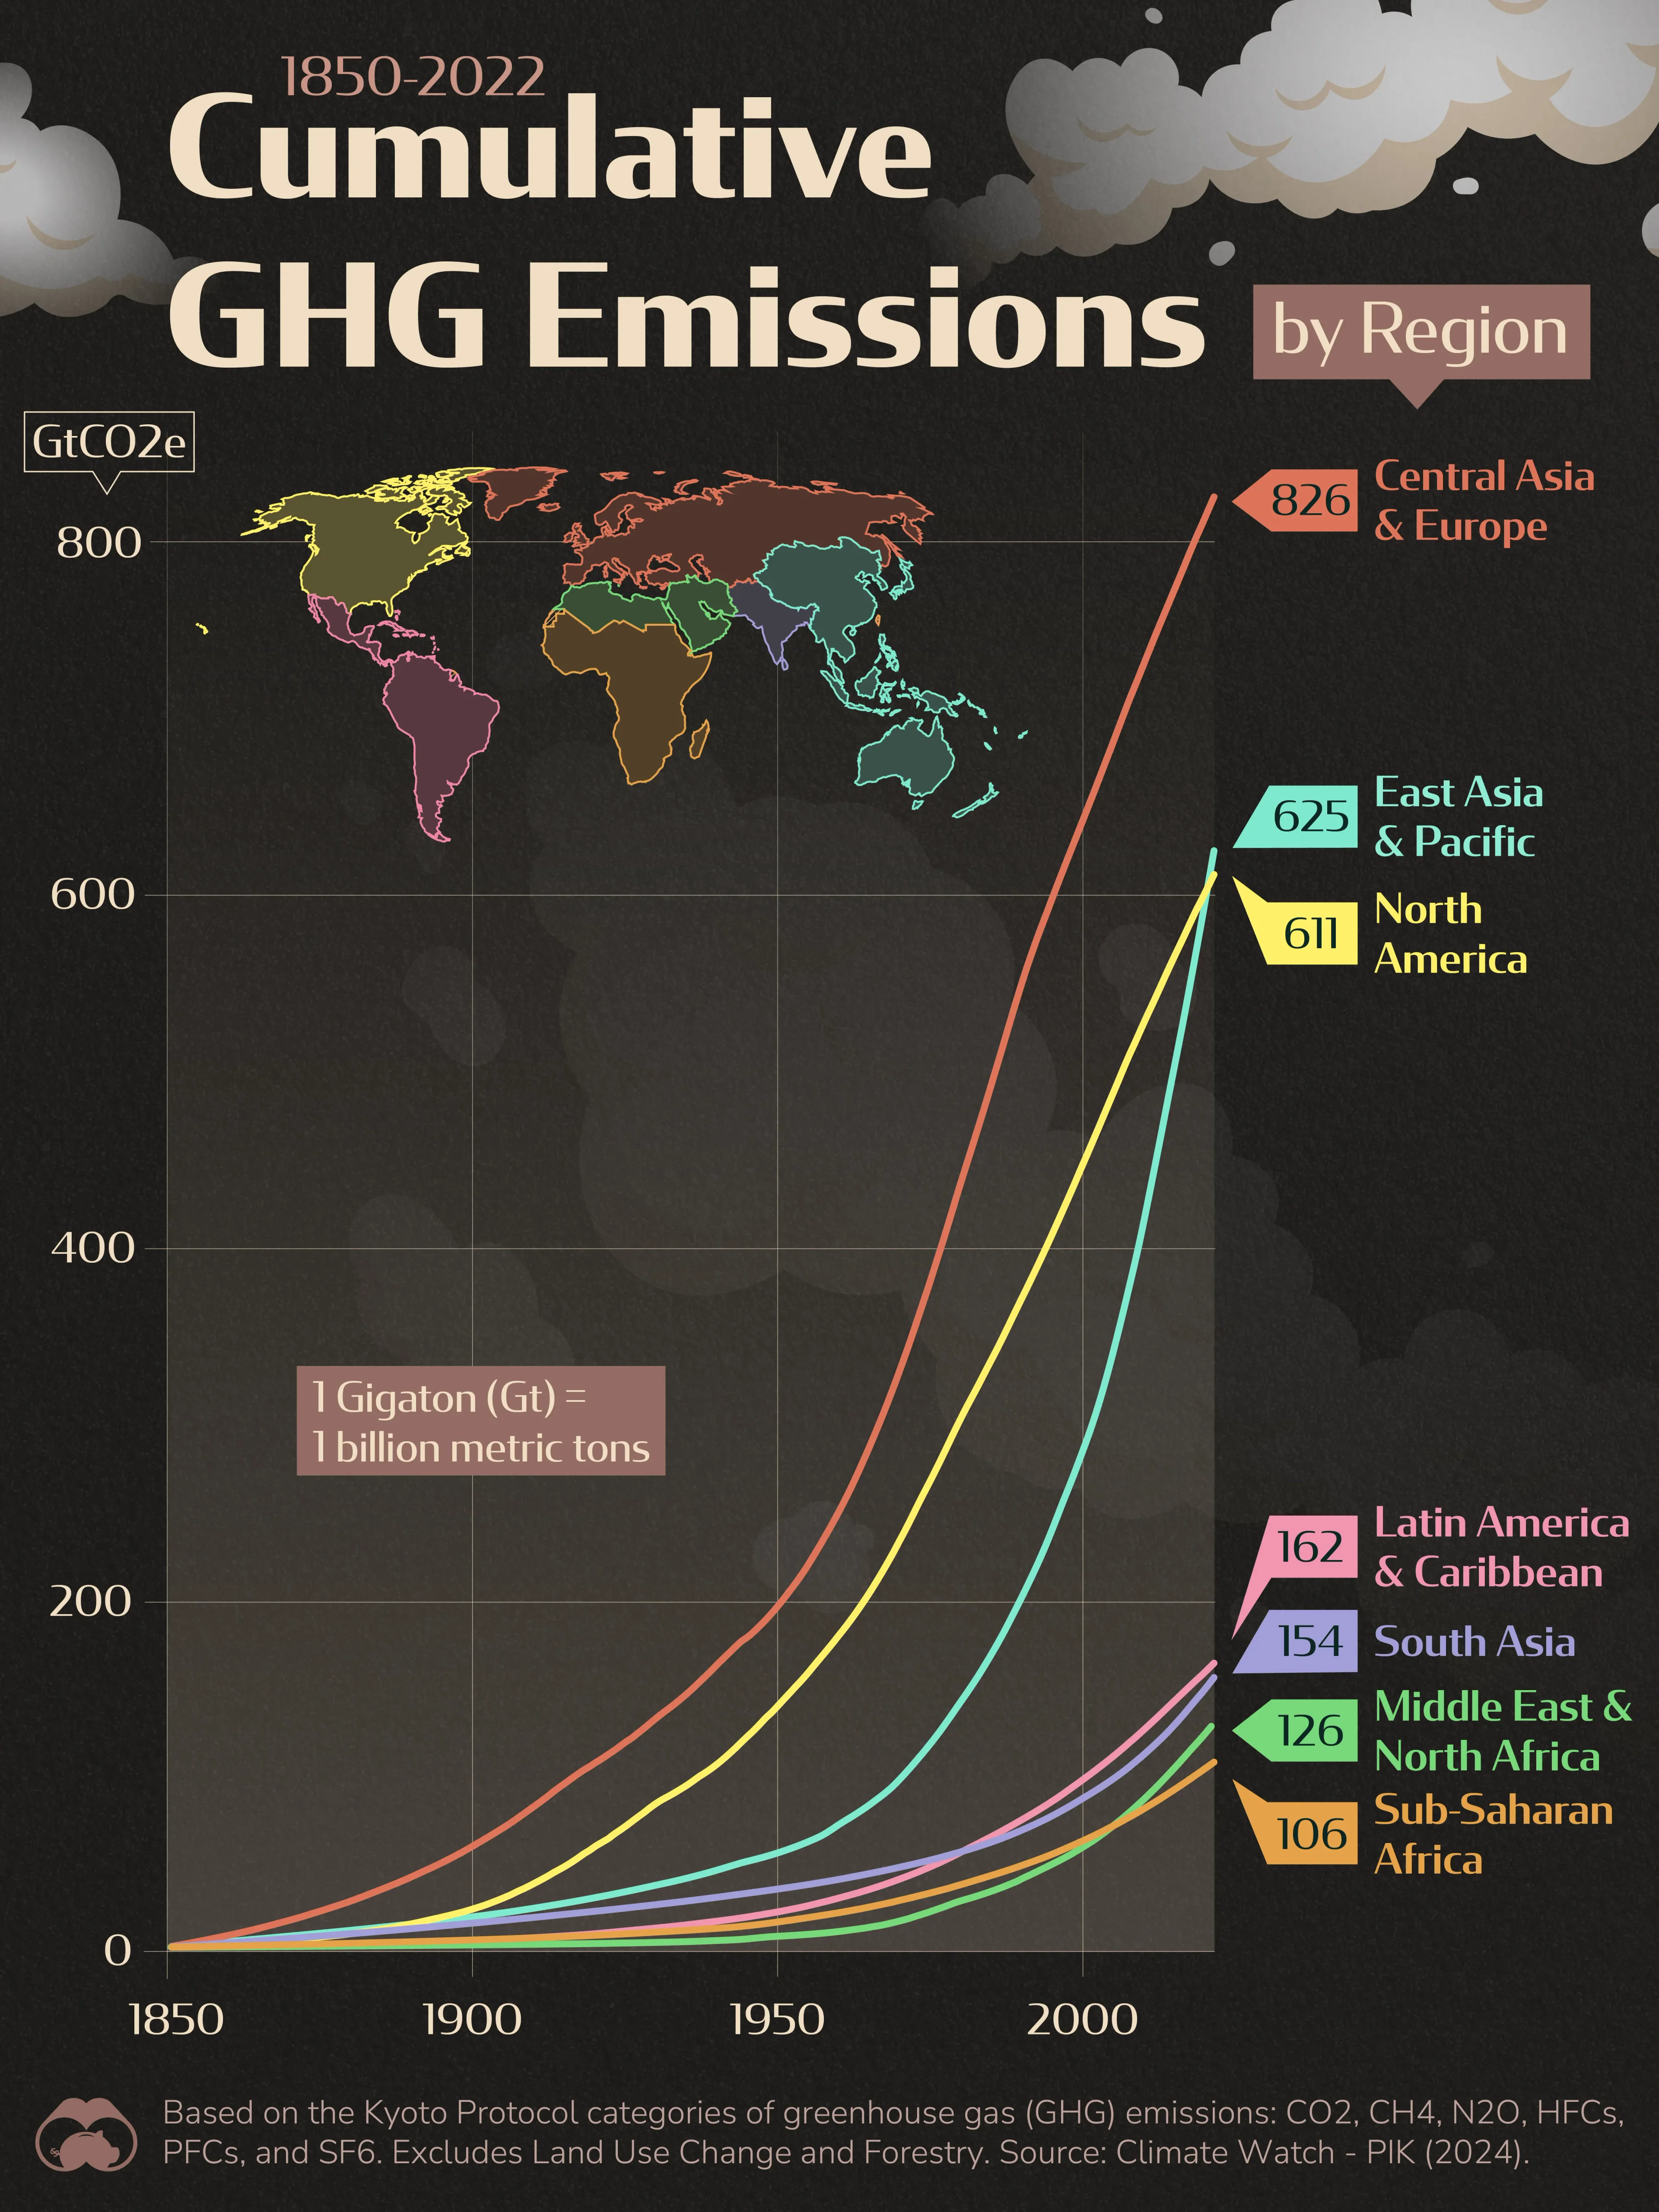
This graphic shows cumulative greenhouse gas (GHG) emissions by region, from 1850 to 2022. This is represented in metric tons of CO2 equivalent.
All figures were sourced from Climate Watch (PIK PRIMAP-hist dataset).