
Where Data Tells the Story
© Voronoi 2026. All rights reserved.

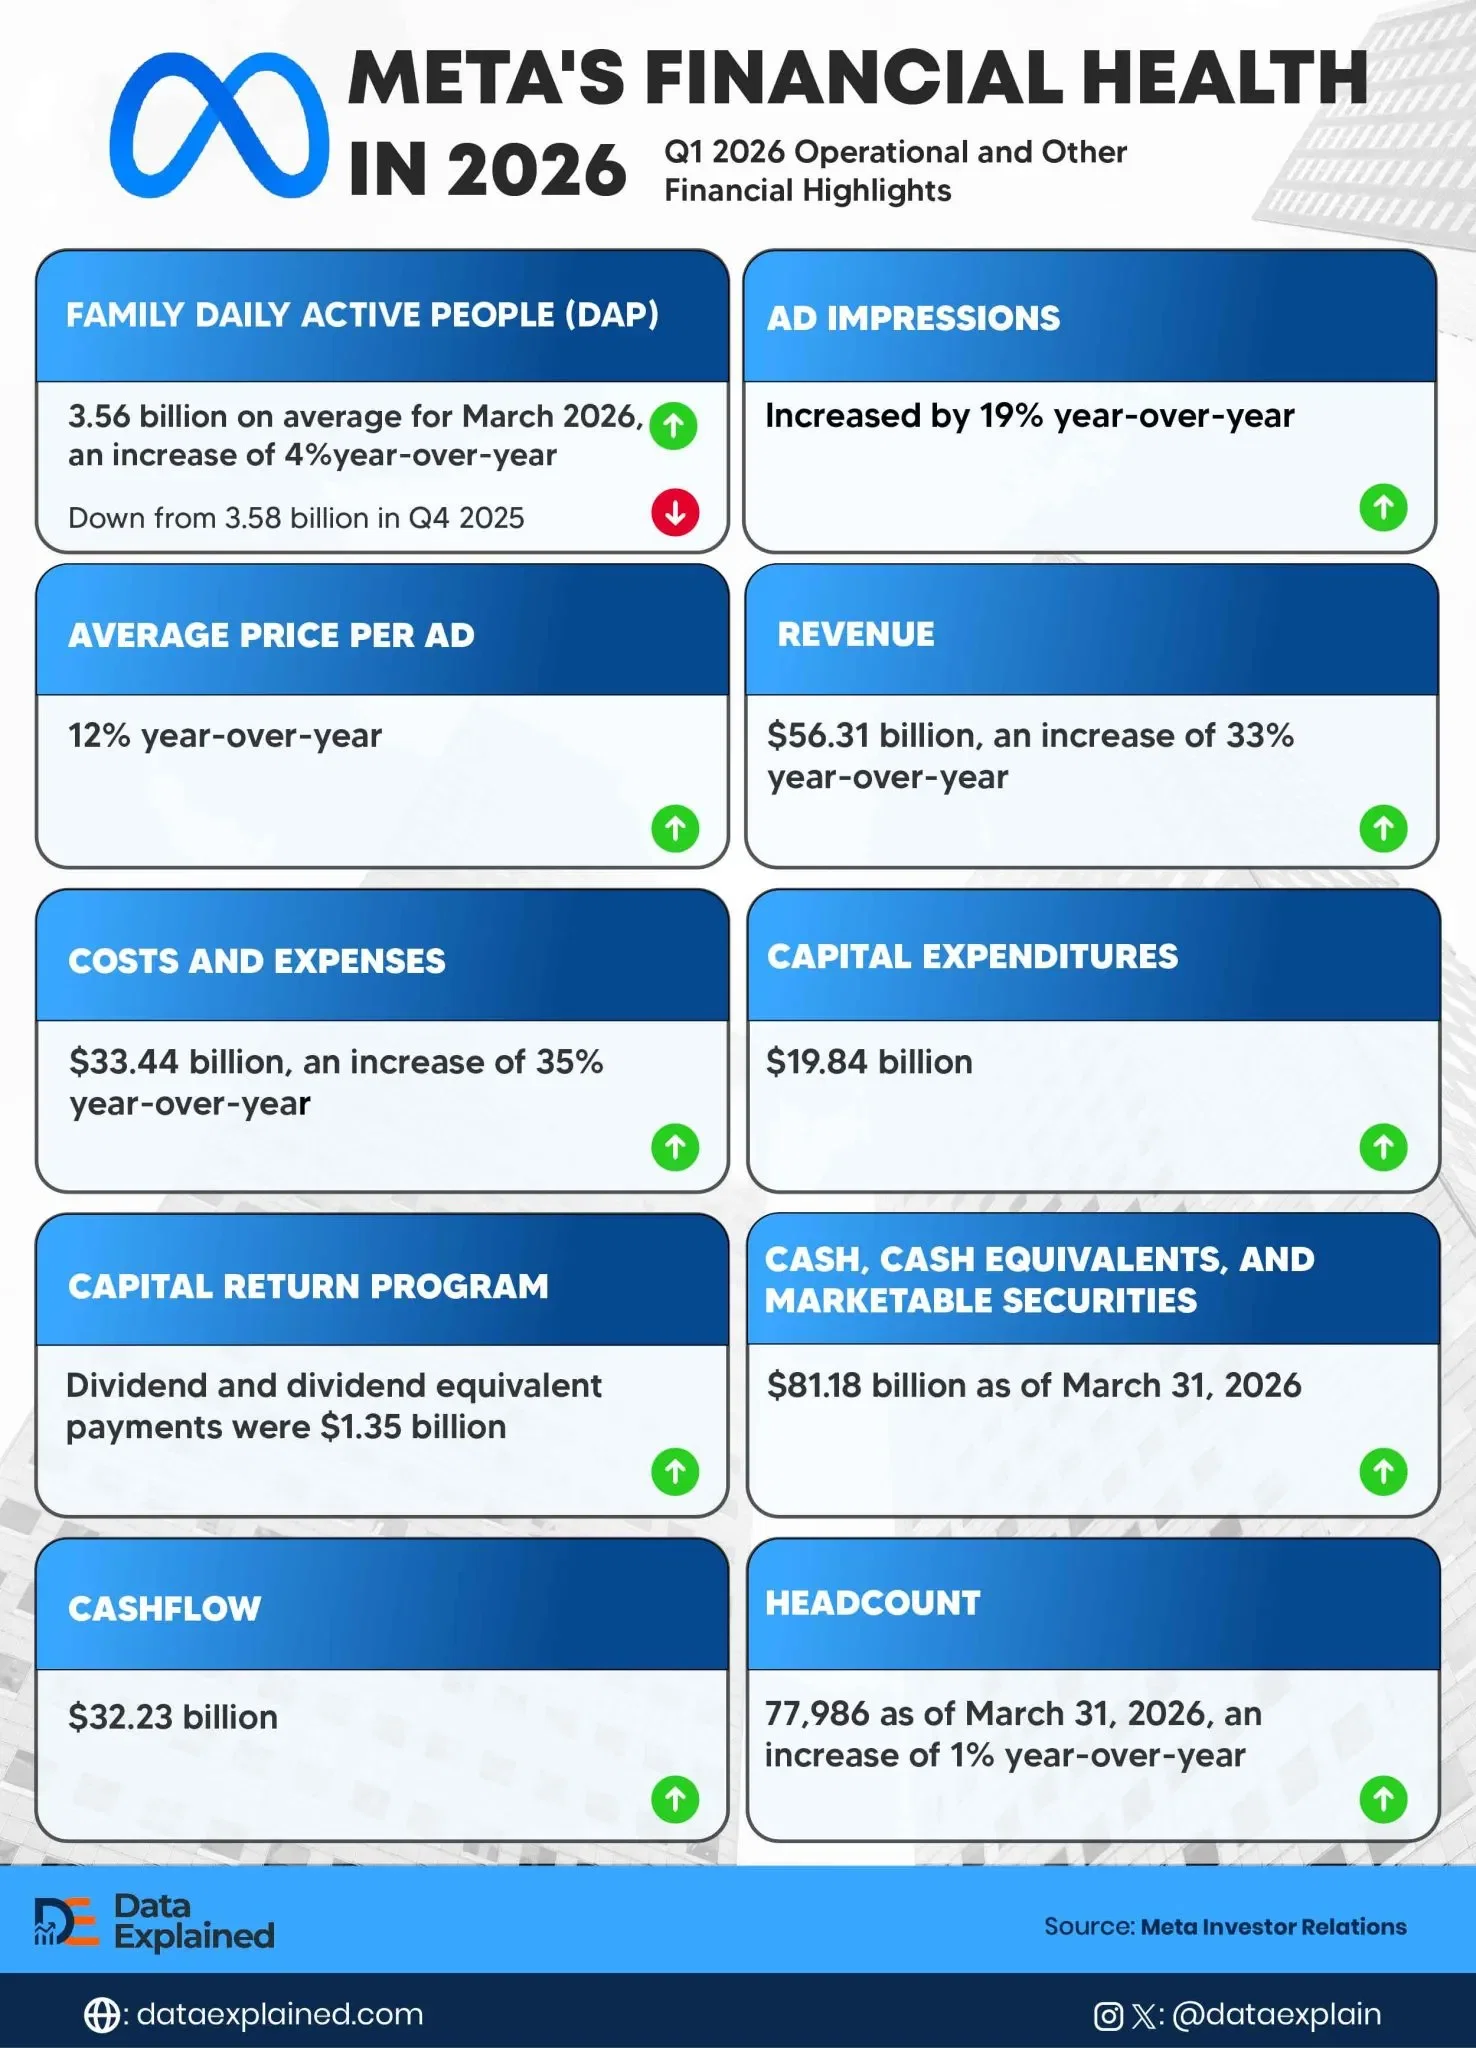
Meta generated $56.31 billion in revenue in the first quarter of 2026. It was a 33% year-over-year increase while losing approximately 20 million daily active users over the same period.
And the fact that they moved in opposite directions in the same quarter is the most analytically significant feature of Meta’s April 29 earnings release.
Today’s infographic focuses on the company’s First Quarter 2026 Operational and Other Financial Highlights.
For most of Meta’s history, user growth and revenue growth have moved together.
More daily users meant more advertising inventory, which meant more revenue.
The 33% revenue growth occurred despite a quarterly decline in users, driven by simultaneous growth in two advertising metrics.
Ad impressions delivered across Meta’s Family of Apps increased 19% year-over-year.
Average price per ad increased 12% year-over-year.
Both volume and price rising at the same time in the same marketplace is unusual; higher prices typically suppress demand for ad inventory.
Meta is generating enough advertiser demand to push both metrics upward concurrently, suggesting its AI-driven ad-targeting improvements are delivering a measurable return on investment that keeps advertisers spending more at higher prices.
Meta is extracting more value from each user even as the quarterly user count dips.