AutomotiveAug 15, 2024
The Worst Cities In The World For Rush Hour Traffic 🚕🛻🚙
What We're Showing
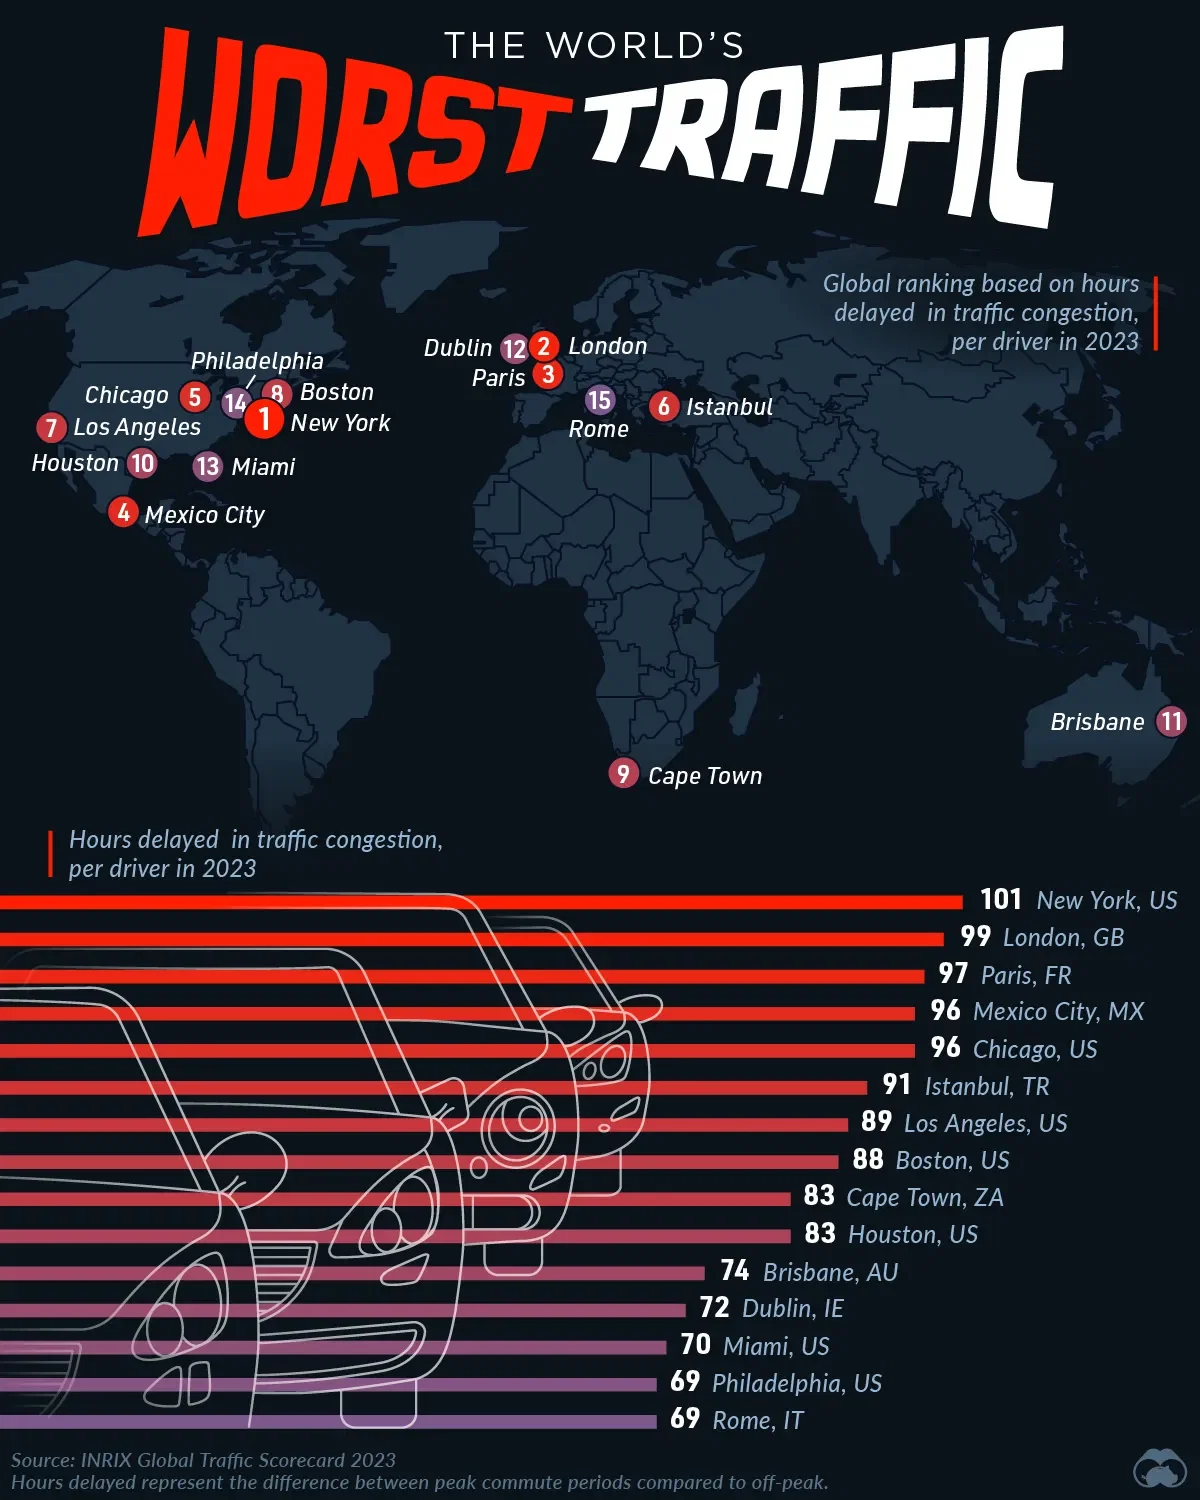
The 15 worst cities in the world for traffic congestion in 2023.
Figures represent the average number of hours lost to traffic congestion per driver per in 2023 when driving during peak commute hours compared to driving during off-peak hours.
Data comes from the INRIX Global Traffic Scorecard 2023.
Key Takeaways
- Major global cities like New York City, London, and Paris top the list due to their roles as economic hubs with dense populations and high numbers of commuters.
- The typical driver in New York lost 101 hours to traffic congestion in 2023, which cost the urban area more than $9.1 billion in lost time.
- Seven out of the 15 worst cities in the world for rush hour traffic were located in the U.S.
Dataset
Urban Area | Country | Hours lost to traffic in 2023 |
---|---|---|
New York City, NY | USA | 101 |
London | UK | 99 |
Paris | FRA | 97 |
Mexico City | MEX | 96 |
Chicago, IL | USA | 96 |
Istanbul | TUR | 91 |
Los Angeles, CA | USA | 89 |
Boston, MA | USA | 88 |
Cape Town | ZAF | 83 |
Houston, TX | USA | 83 |
Brisbane | AUS | 74 |
Dublin | IRL | 72 |
Miami, FL | USA | 70 |
Philadelphia, PA | USA | 69 |
Rome | ITA | 69 |
Data sources
Hours delayed in traffic represent the total number of hours lost in congestion during peak commute periods compared to off-peak conditions.
26
0
2.6K