AutomotiveAug 5, 2024
The Average Annual Cost of Owning a Car Surpasses $12,000
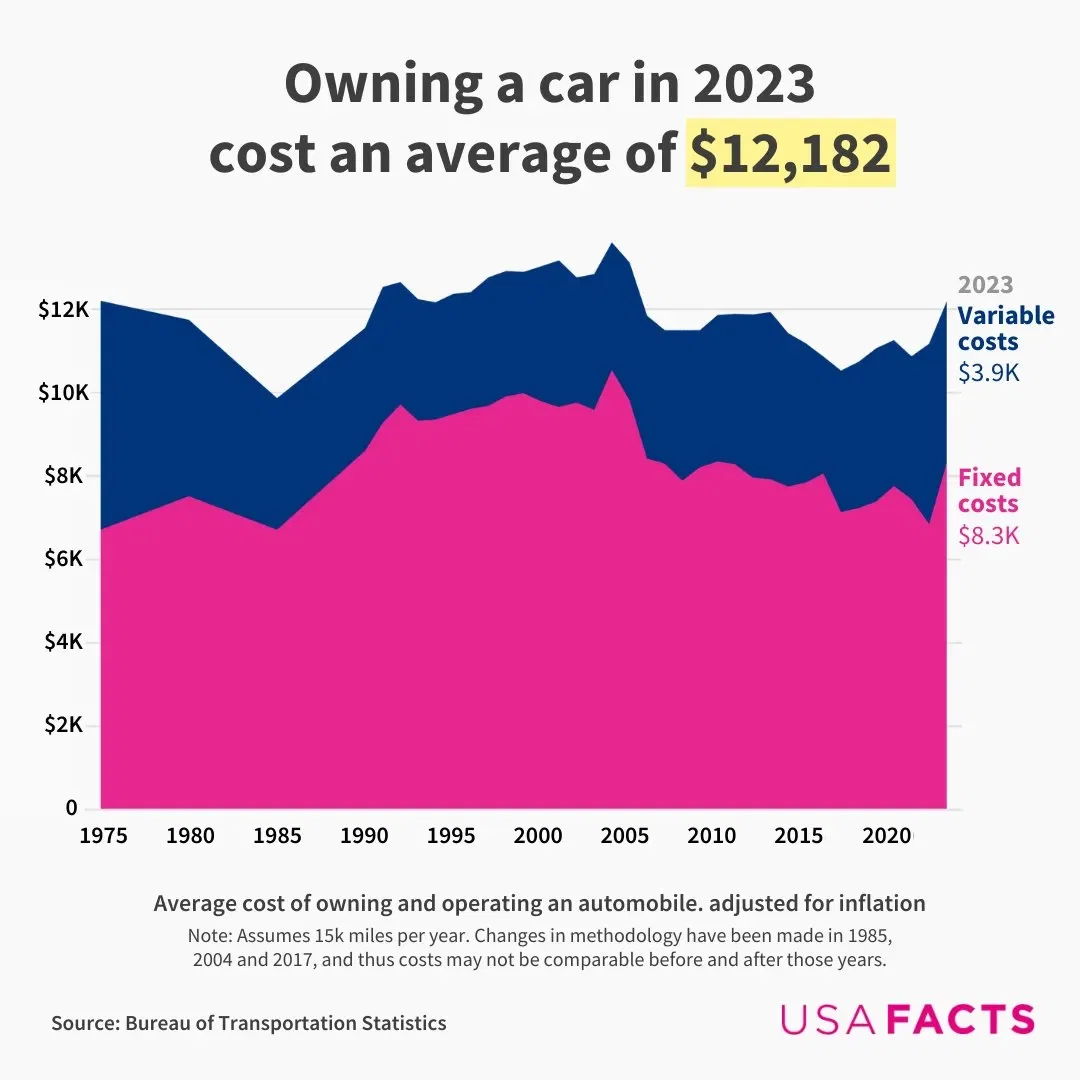
Owning and operating a car involves both fixed and variable costs. Fixed costs, also known as ownership costs, do not change based on how much you drive and include insurance, license, registration, taxes, depreciation, and finance charges. Variable costs, also known as operating costs, involve the physical aspects of vehicle operation and include gasoline, maintenance, and tires.
How have these costs changed over time?
Data stretching back to 1975 shows shifts in the costs of owning a car. Here’ are the inflation-adjusted average costs per 15,000 miles driven per year:
- 1975: Total cost was approximately $12,199, with fixed costs at 55% and variable costs at 45%
- 1985: Total costs fell to $9,866, with fixed costs increasing to 68%
- 1995: Total costs increased to $12,366, maintaining a similar cost structure
- 2005: Total costs hovered around $13,121, with fixed costs slightly reduced to around 66%
- 2015: Total costs amounted to $11,182, with fixed costs making up 70%
- 2023: Total costs were $12,182, with fixed costs comprising approximately 68%
Dataset
Year | Fixed cost | Variable costs |
---|---|---|
1975 | 6717.036654 | 5482.370558 |
1980 | 7517.708325 | 4226.630898 |
1985 | 6714.204851 | 3151.79671 |
1990 | 8611.853007 | 2937.448508 |
1991 | 9275.289956 | 3255.076432 |
1992 | 9716.584091 | 2931.915182 |
1993 | 9328.731128 | 2909.956817 |
1994 | 9356.941984 | 2806.465789 |
1995 | 9486.948753 | 2879.074016 |
1996 | 9611.027393 | 2796.500191 |
1997 | 9687.814991 | 3075.496822 |
1998 | 9913.096356 | 3000.286564 |
1999 | 9986.031933 | 2908.020288 |
2000 | 9792.223391 | 3236.352834 |
2001 | 9658.932964 | 3509.836702 |
2002 | 9762.658855 | 2997.901834 |
2003 | 9586.521076 | 3254.018641 |
2004 | 10550.85115 | 3048.633033 |
2005 | 9821.295904 | 3299.768203 |
2006 | 8417.090466 | 3423.363244 |
2007 | 8300.088241 | 3196.298145 |
2008 | 7891.289727 | 3601.745401 |
2009 | 8213.462787 | 3285.101059 |
2010 | 8350.603295 | 3508.762529 |
2011 | 8282.014359 | 3605.940828 |
2012 | 7962.803906 | 3909.736718 |
2013 | 7923.714316 | 4007.636293 |
2014 | 7749.606068 | 3674.659579 |
2015 | 7844.549564 | 3337.340326 |
2016 | 8061.671951 | 2803.176641 |
2017 | 7137.723907 | 3388.6164 |
2018 | 7232.072065 | 3505.613456 |
2019 | 7390.594046 | 3672.056161 |
2020 | 7762.035949 | 3494.270089 |
2021 | 7448.595963 | 3420.686733 |
2022 | 6848.780154 | 4321.873886 |
2023 | 8318 | 3864 |
Data sources
Changes in methodology have been made in 1985, 2004 and 2017, and thus costs may not be comparable before and after those years.
20
0
5.0K