
Highest and Lowest Driver Death Rates by Vehicle Model
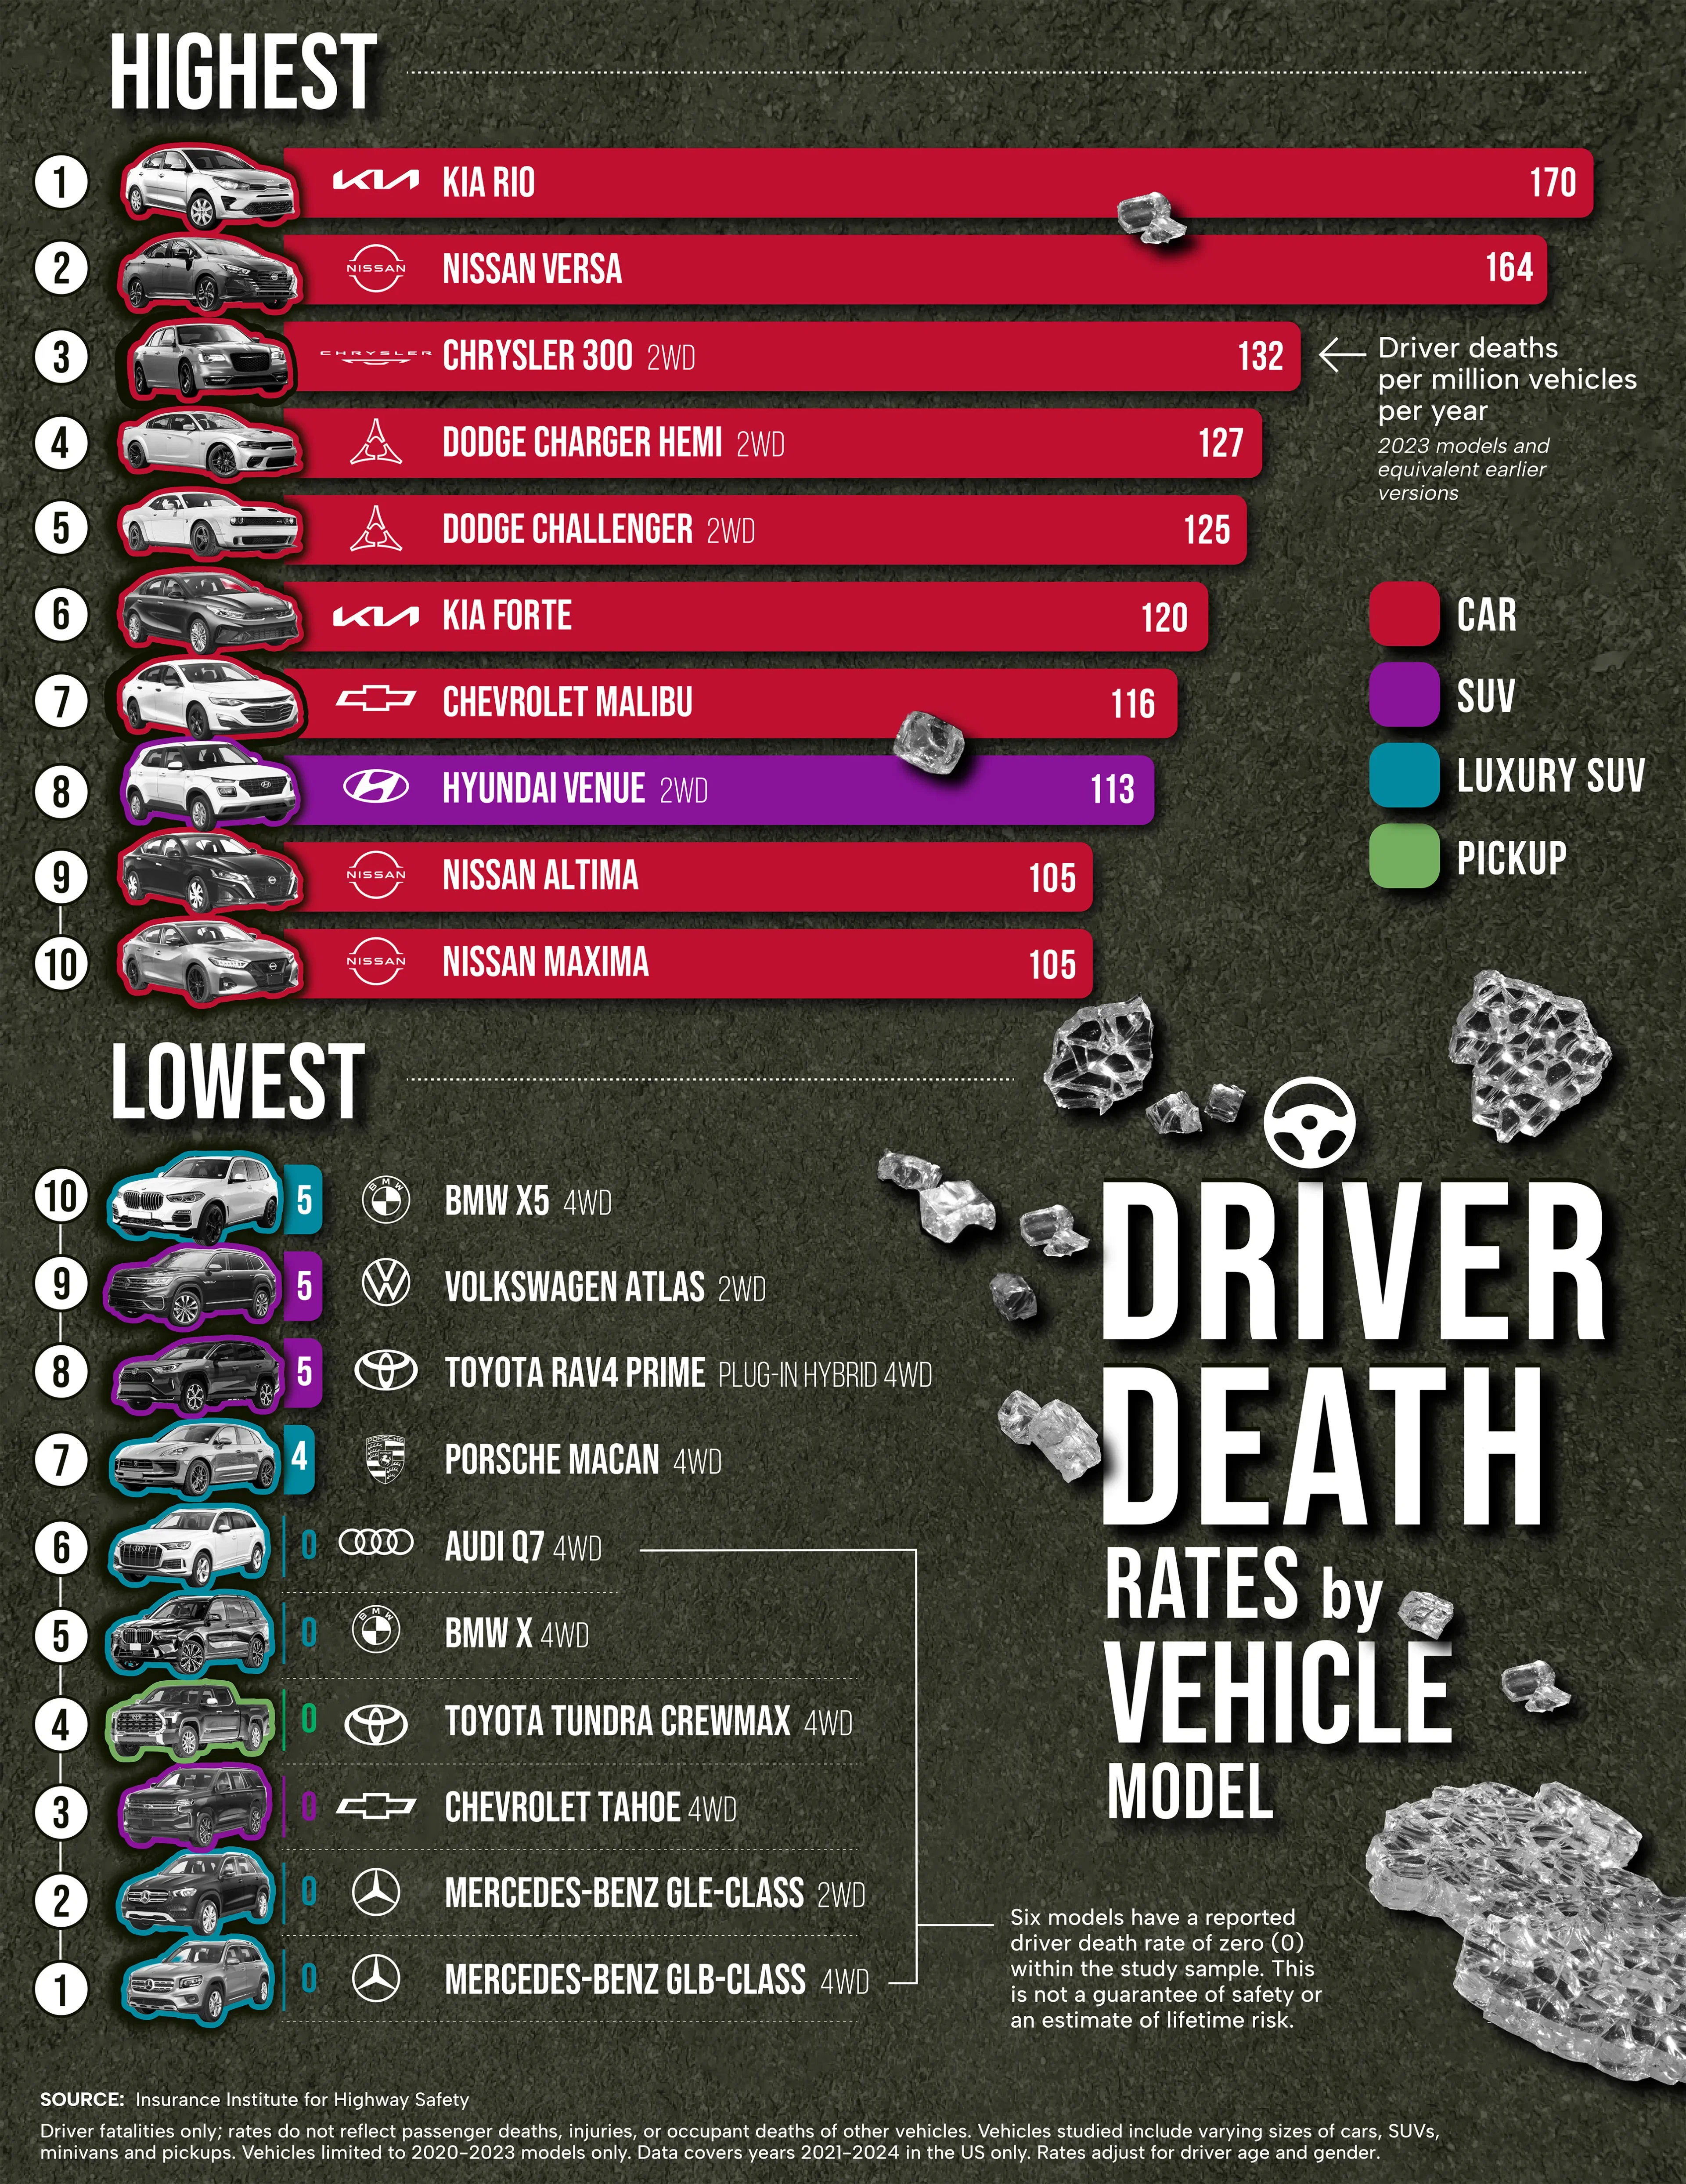
Which vehicles have the highest and lowest driver death rates? This chart compares the extremes of the study data: the 10 highest and 10 lowest rates calculated by the Insurance Institute for Highway Safety (IIHS), using U.S. crash deaths recorded during 2021–2024.
The data is for 2023 models, including equivalent earlier models in the intervening years back to 2020. Vehicles studied include all sizes of cars, SUVs, minivans and pickups. Of the182 total vehicle models and variants in the study's comparison, the Kia Rio, classified as a "minicar," had the highest rate. It is also the only minicar of the study.
Several luxury SUVs appear among the 10 with the lowest rates. These results may reflect advanced safety features as well as differences in how much their owners drive.
Six vehicle models recorded no driver deaths in the study sample. Their zero rates describe this particular population and period; is not a guarantee of safety or an estimate of lifetime risk.
Only one pickup, the Toyota Tundra Crewmax, makes the list.. While minivans were compared in the study, none are in the top or bottom 10's.
Rate rankings are for driver deaths only, they do not reflect passenger deaths, injuries, or deaths in other vehicles.
Methodology: Rates are driver deaths per million registered vehicle-years. One registered vehicle-year means one vehicle registered for one year. To qualify for an individual estimate, a vehicle model or variant needed at least 100,000 registered vehicle-years or at least 20 driver deaths during 2021–2024. The analysis focuses on model year 2023. Earlier model years dating back to 2020 were included only when there were no substantial safety-related design changes. Different body styles and drivetrains can receive separate estimates. Death data came from NHTSA’s Fatality Analysis Reporting System; registration data came from Mobility Global. IIHS adjusted rates for driver age and gender, but not for mileage or all differences in driving behavior. Estimates have statistical uncertainty, so small differences should be interpreted cautiously.
