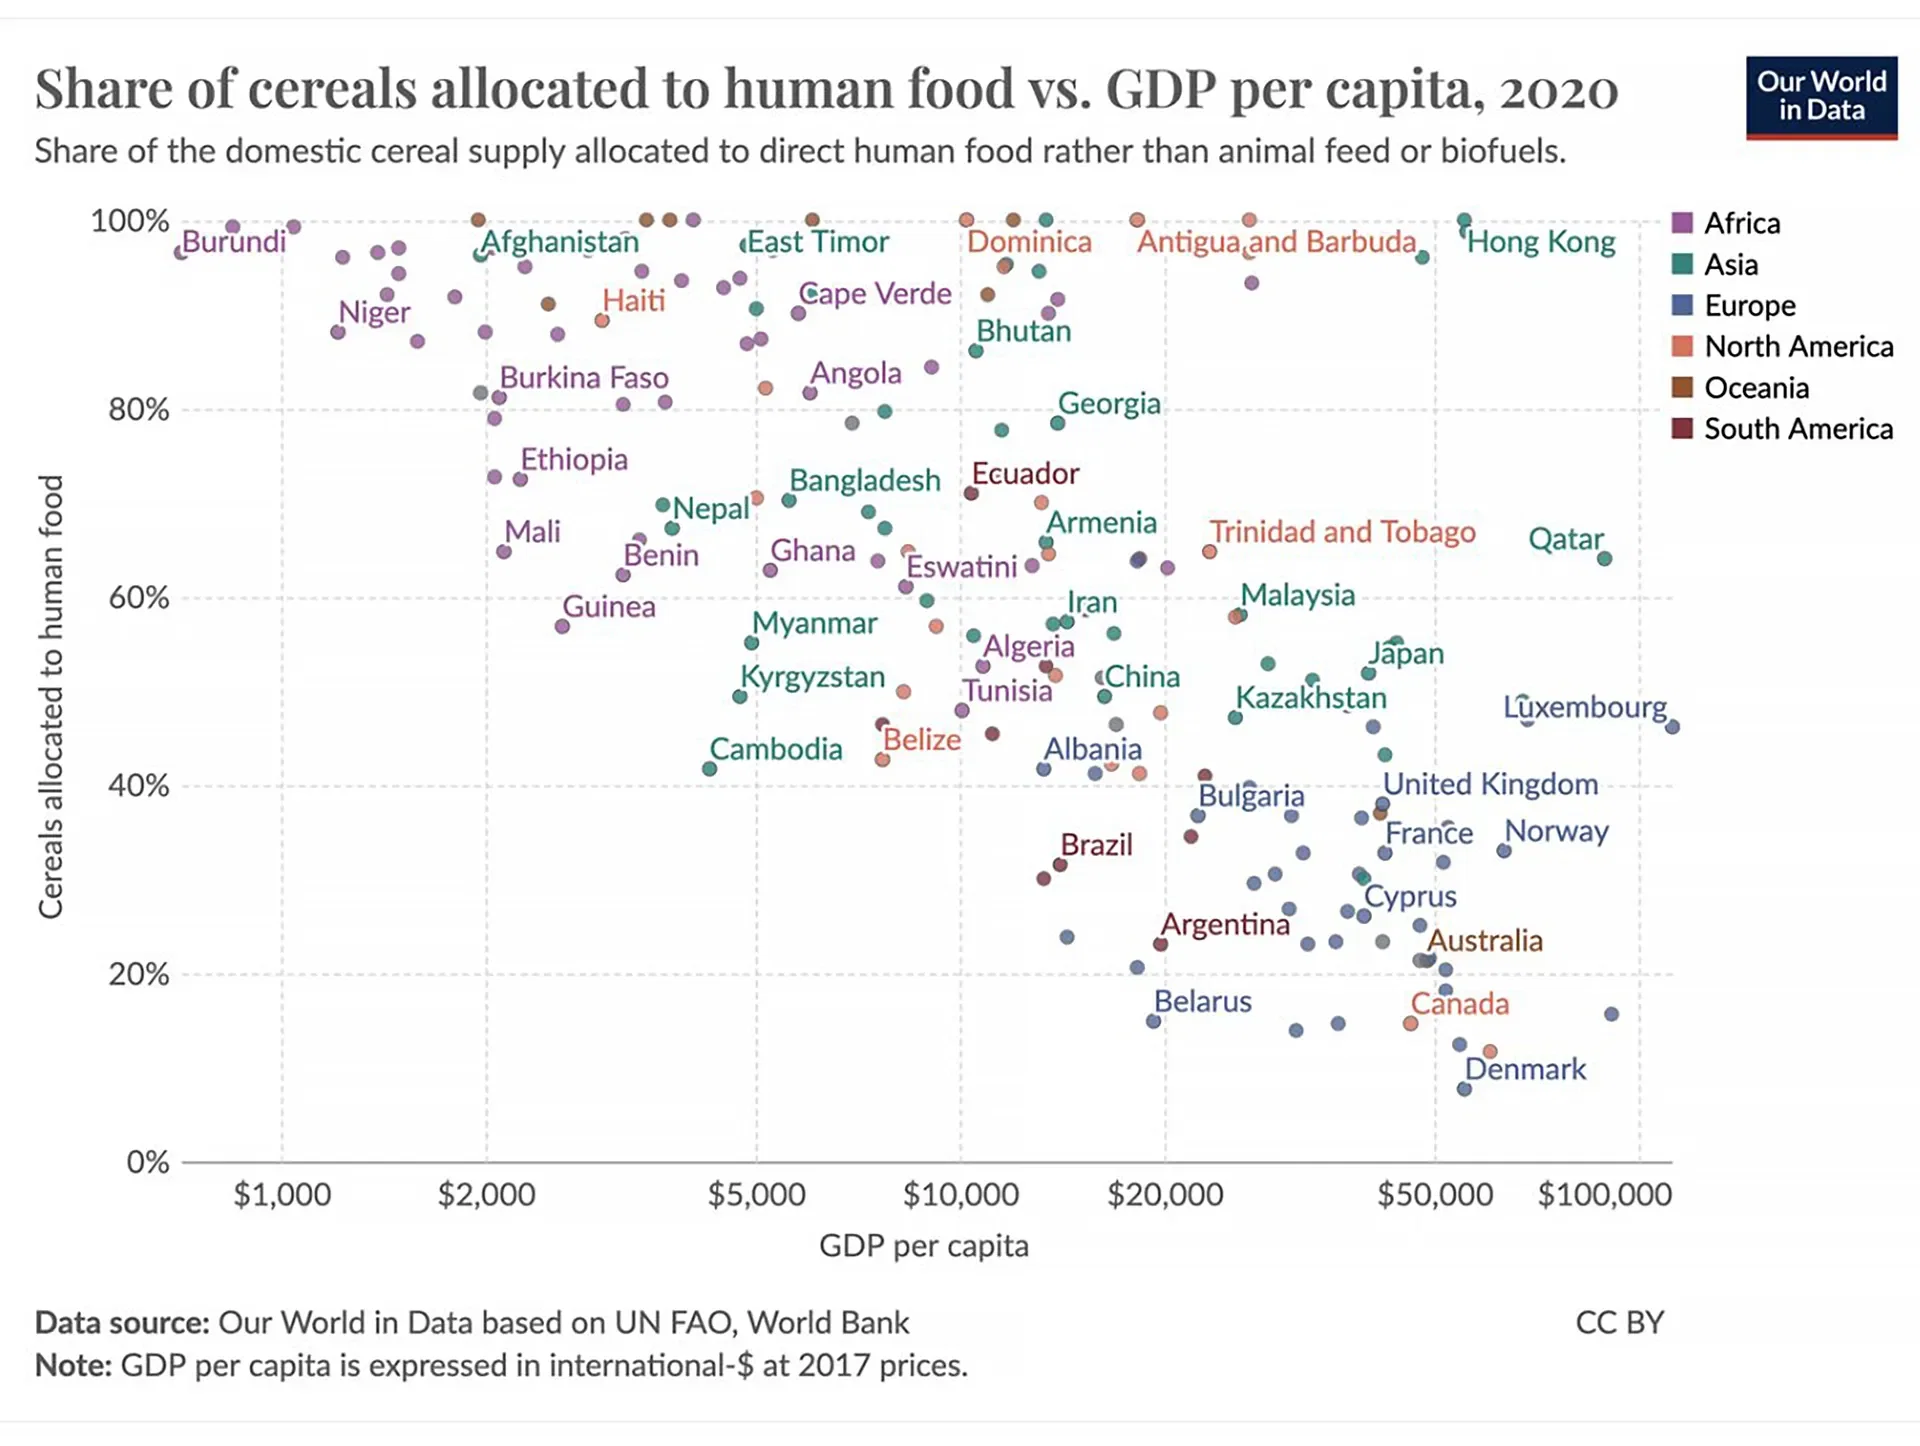
Richer Countries Often Use Much of Their Crops for Animal Feed and Biofuels
Richer countries tend to use less of their crops for human food, and more for animal feed and biofuels. This is what the chart shows: in several countries, less than a quarter of cereals are used for direct consumption as human food.
In poorer countries, supplies are tighter and they can't afford the inefficiency. Most crop production goes directly to human consumption.
Dataset
Entity | Year | Share of cereals that are allocated to human food | GDP per capita, PPP (constant 2017 international $) |
---|---|---|---|
World | 1961 | 56.800938 | |
World | 1962 | 56.77568 | |
World | 1963 | 56.611557 | |
World | 1964 | 56.47263 | |
World | 1965 | 53.850395 | |
World | 1966 | 54.03401 | |
World | 1967 | 53.65031 | |
World | 1968 | 52.68029 | |
World | 1969 | 51.67469 | |
World | 1970 | 51.871635 | |
World | 1971 | 50.391724 | |
World | 1972 | 49.903828 | |
World | 1973 | 50.34395 | |
World | 1974 | 51.750137 | |
World | 1975 | 52.16456 | |
World | 1976 | 51.264217 | |
World | 1977 | 50.59738 | |
World | 1978 | 50.345108 | |
World | 1979 | 49.854866 | |
World | 1980 | 50.700283 | |
World | 1981 | 50.96134 | |
World | 1982 | 51.023266 | |
World | 1983 | 52.504055 | |
World | 1984 | 51.625484 | |
World | 1985 | 52.139027 | |
World | 1986 | 51.571068 | |
World | 1987 | 51.947285 | |
World | 1988 | 54.026943 | |
World | 1989 | 53.558994 | |
World | 1990 | 52.48343 | 9697.508 |
World | 1991 | 53.488346 | 9667.7 |
World | 1992 | 53.610386 | 9665.21 |
World | 1993 | 54.33093 | 9670.078 |
World | 1994 | 54.255165 | 9791.423 |
World | 1995 | 55.020954 | 9949.668 |
World | 1996 | 54.209053 | 10175.511 |
World | 1997 | 54.26933 | 10418.802 |
World | 1998 | 54.765408 | 10526.854 |
World | 1999 | 54.903843 | 10749.006 |
World | 2000 | 54.241276 | 11108.324 |
World | 2001 | 53.532013 | 11215.04 |
World | 2002 | 53.38859 | 11367.639 |
World | 2003 | 53.20272 | 11637.828 |
World | 2004 | 51.89035 | 12074.206 |
World | 2005 | 51.961754 | 12463.141 |
World | 2006 | 52.296665 | 12933.736 |
World | 2007 | 51.29537 | 13428.616 |
World | 2008 | 49.59249 | 13622.655 |
World | 2009 | 50.215664 | 13359.558 |
World | 2010 | 54.18585 | 13868.406 |
World | 2011 | 54.125843 | 14230.719 |
World | 2012 | 54.344864 | 14504.989 |
World | 2013 | 53.454563 | 14789.622 |
World | 2014 | 53.920063 | 15112.653 |
World | 2015 | 52.637917 | 15433.18 |
World | 2016 | 51.557182 | 15750.084 |
World | 2017 | 51.33494 | 16156.354 |
World | 2018 | 51.820236 | 16558.998 |
World | 2019 | 50.92317 | 16847.46 |
World | 2020 | 50.839428 | 16175.776 |
World | 2021 | 50.613678 | 16997.135 |
Data sources
Food and Agriculture Organization of the United Nations (2023) – with major processing by Our World in Data. “Cereals allocated to human food – FAO” [dataset]. Food and Agriculture Organization of the United Nations, “Food Balances: Food Balances (-2013, old methodology and population)”; Food and Agriculture Organization of the United Nations, “Food Balances: Food Balances (2010-)” [original data].