A Decade of Happiness Gains for Eastern Europe

What we’re showing:
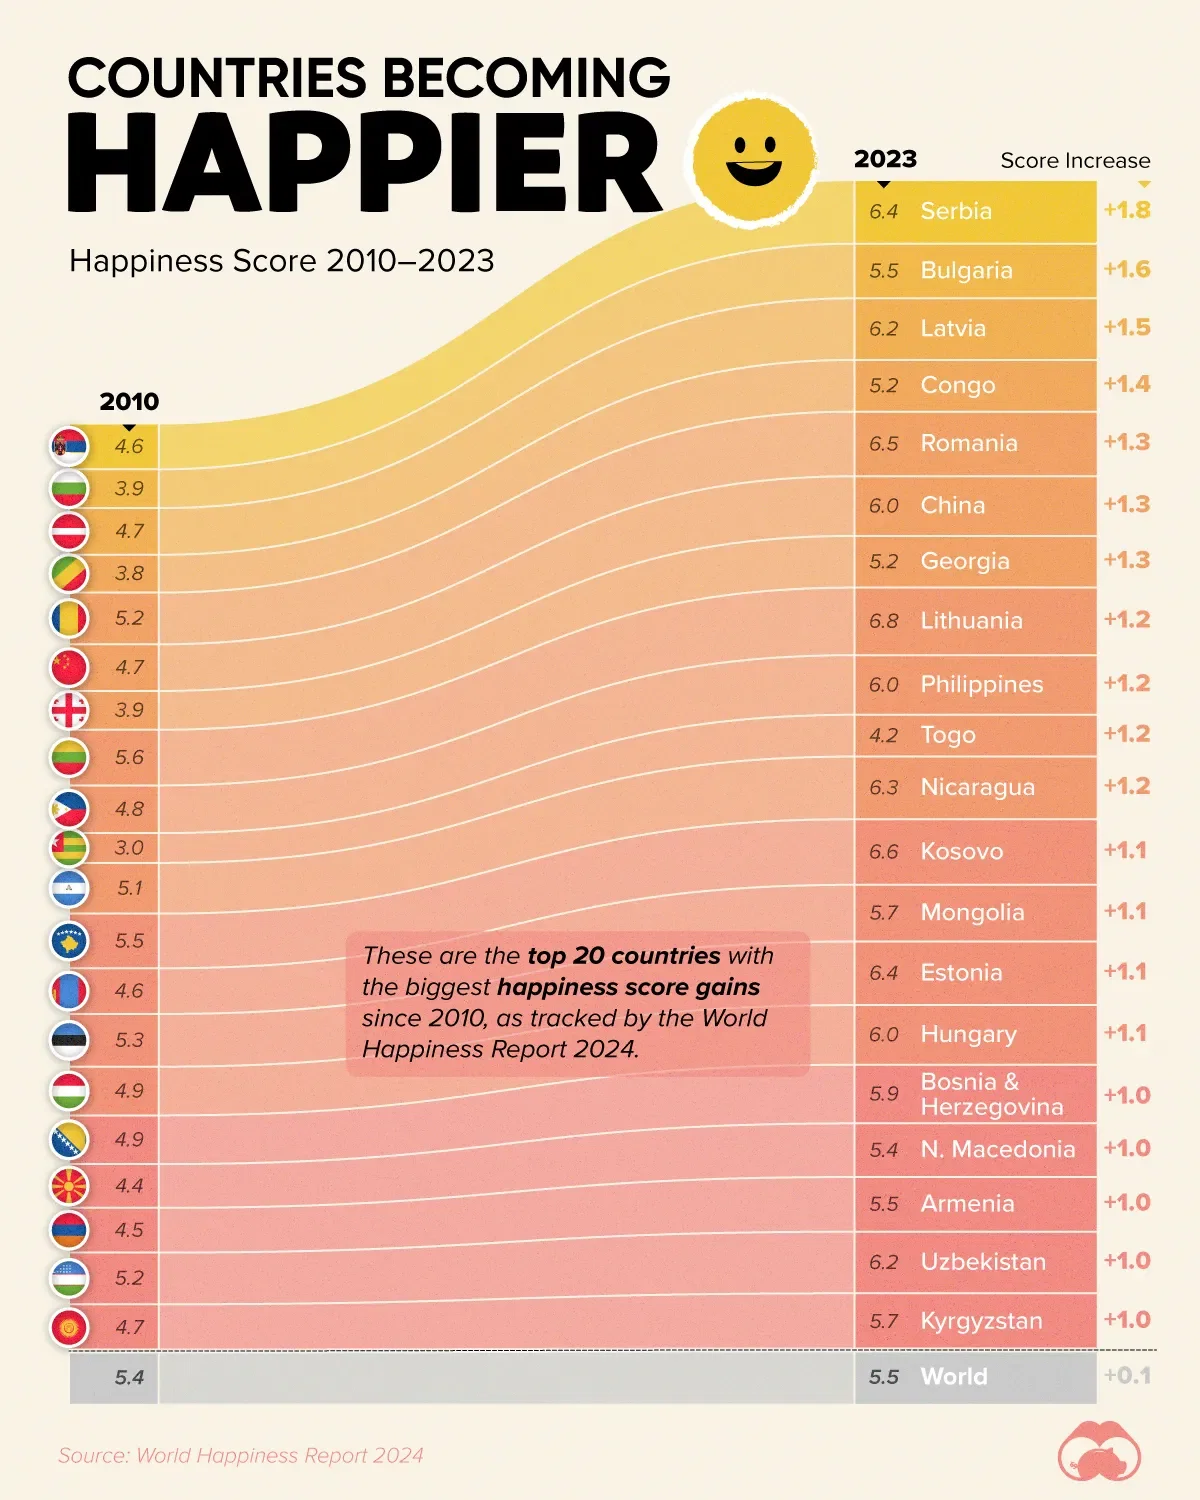
A bar chart with the top 20 countries whose happiness has grown since 2010, ranked by their score increases. All values are out of 10.
Key Takeaway
Serbia leads a list of 12 Eastern European nations whose average happiness has improved more than 20% in the last decade.
In the same time period, the Serbian economy grew about 3x to $142 billion, and its per capita GDP has doubled to $11,300. (All numbers not accounting for inflation).
Eastern Europe as a whole is seeing their happiness levels converge closer to their Western counterparts, as noted by the World Happiness Report. In fact, for those under 30, happiness scores across the continent are nearly the same.
Twenty countries in total have increased their happiness score by a full point or more, on the 0–10 scale.
How is “Happiness” Calculated?
The World Happiness Report sources their data from the Gallup World Poll, which asks 1,000 respondents in nearly every country to evaluate their life on a 0–10 scale, with 10 representing the best life they could lead, and 0 the worst. Results are then averaged over three-years, and the final number taken as a “happiness” score. The above chart represents a score gain (out of 10) over the last decade.