Where Data Tells the Story
© Voronoi 2026. All rights reserved.
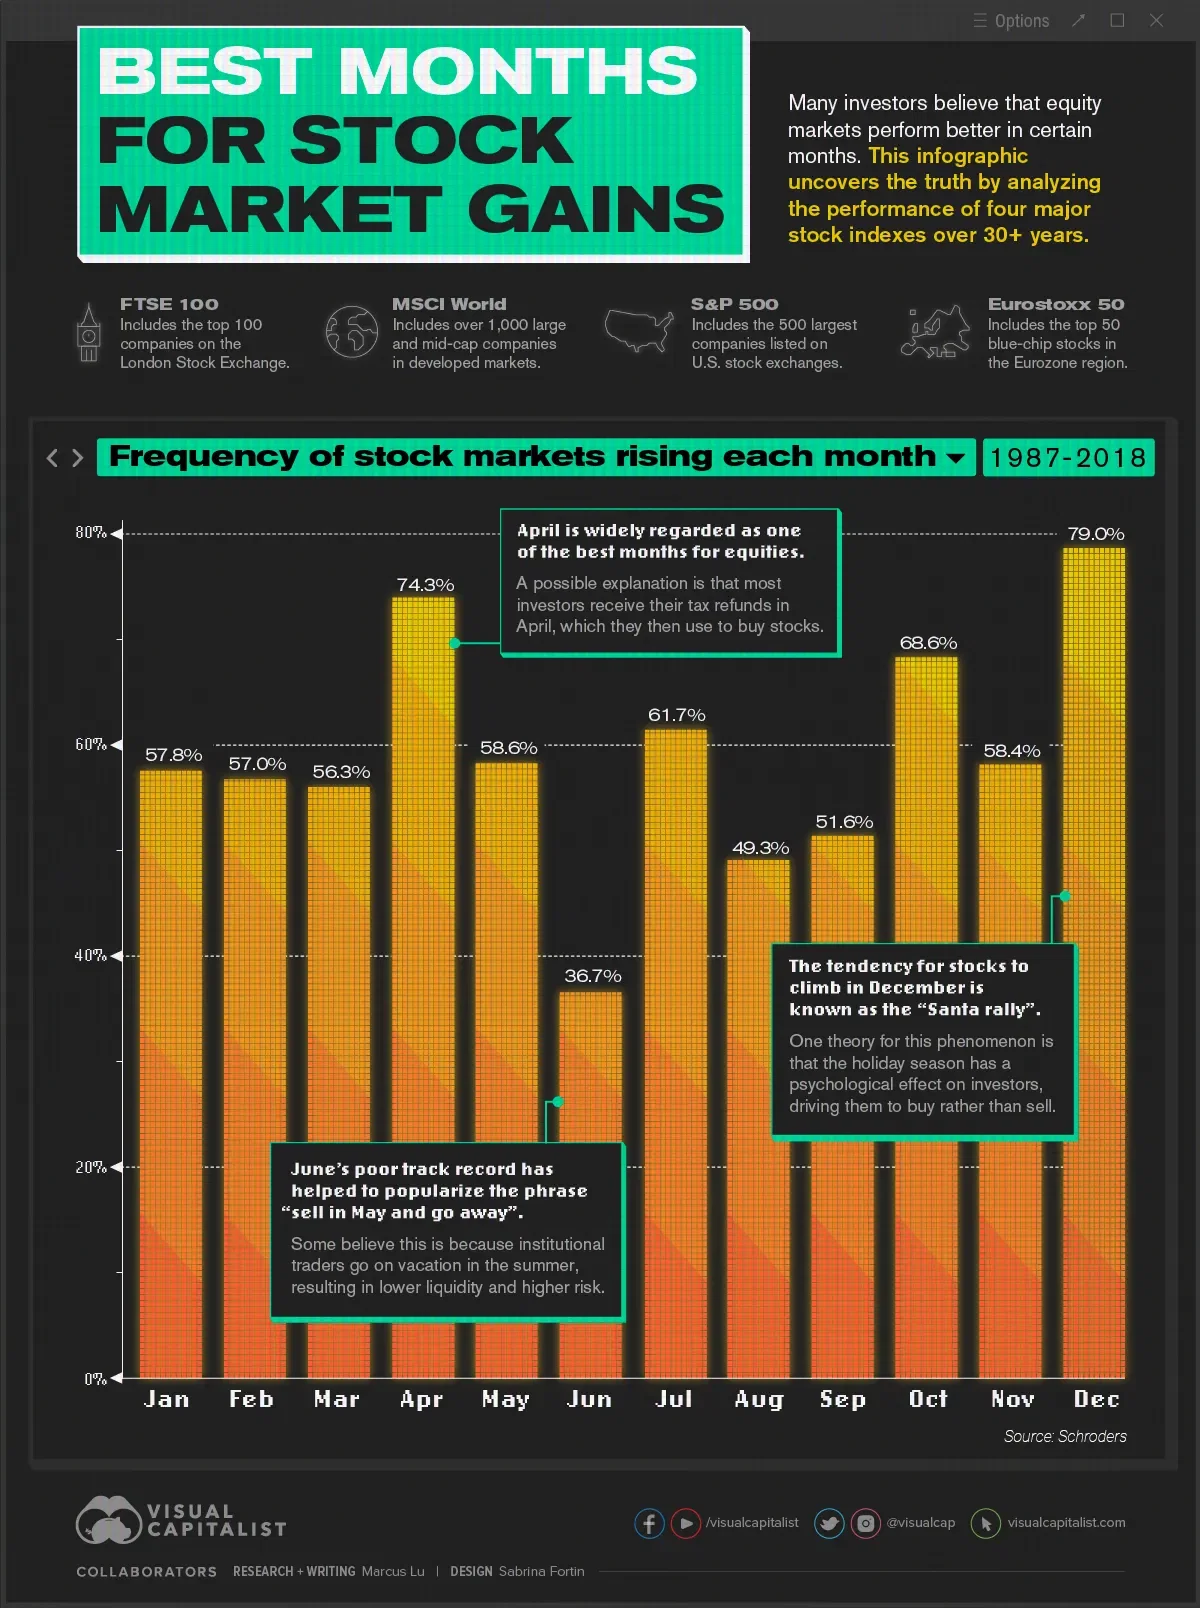
Many investors believe that equity markets perform better during certain times of the year.
Is there any truth to these claims, or is it superstitious nonsense? This infographic uses data gathered by Schroders, a British asset management firm, to investigate.
This analysis is based on 31 years of performance across four major stock indexes:
The percentages in the infographic represent the historical frequency of these indexes rising in a given month, between the years 1987 and 2018.
There are some outliers in this dataset that we’ll focus on below.
In terms of frequency of growth, December has historically been the best month to own stocks. This lines up with a phenomenon known as the “Santa Claus Rally”, which suggests that equity markets rally over Christmas. One theory is that the holiday season has a psychological effect on investors, driving them to buy rather than sell. We can also hypothesize that many institutional investors are on vacation during this time. This could give bullish retail investors more sway over the direction of the market.
The second best month was April, which is commonly regarded as a strong month for the stock market. One theory is that many investors receive their tax refunds in April, which they then use to buy stocks. The resulting influx of cash pushes prices higher.
Speaking of higher prices, we can also look at this trend from the perspective of returns. Focusing on the S&P 500, and looking back to 1928, April has generated an average return of 0.88%. This is well above the all-month average of 0.47%.
The three worst months to own stocks, according to this analysis, are June, August, and September. Is it a coincidence that they’re all in the summer?
One theory for the season’s relative weakness is that institutional traders are on vacation, similar to December. Without the holiday cheer, however, the market is less frothy and the reduced liquidity leads to increased risk.
Whether you believe this or not, the data does show a convincing pattern. It’s for this reason that the phrase “sell in May and go away” has become popularized.
Investors should remember that this data is based on historical results, and should not be used to make forward-looking decisions in the stock market.
Anomalies like the COVID-19 pandemic in 2020 can have a profound impact on the world, and the market as a whole. Stock market performance during these times may deviate greatly from their historical averages seen above.
Regardless, this analysis can still be useful to investors who are trying to understand market movements. For example, if stocks rise in December without any clear catalyst, it could be the famed Santa Claus Rally at work.